Copyright
©2012 Baishideng Publishing Group Co.
World J Gastroenterol. Apr 14, 2012; 18(14): 1680-1688
Published online Apr 14, 2012. doi: 10.3748/wjg.v18.i14.1680
Published online Apr 14, 2012. doi: 10.3748/wjg.v18.i14.1680
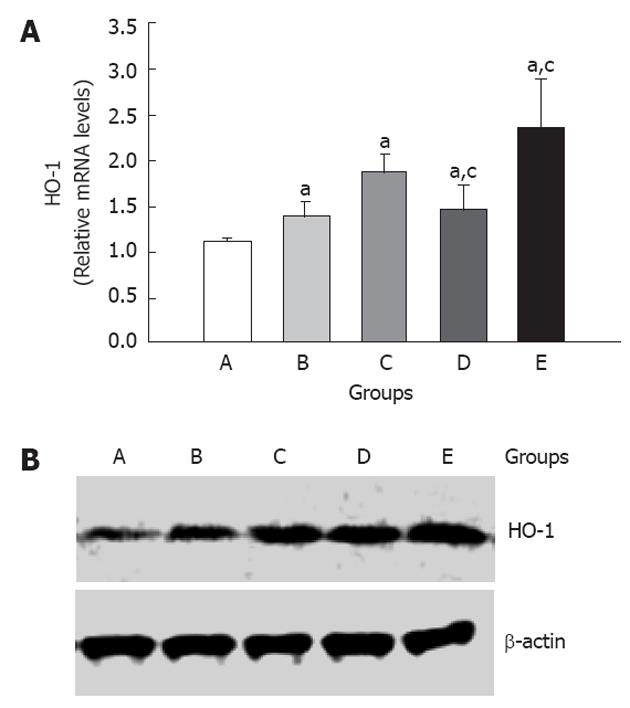
Figure 1 Effects of hemin and zinc protoporphyrin on the expression of heme oxygenase-1 in the liver of rats with fibrosis caused by CCl4.
Group A (normal, untreated); group B (model for 4 wk, untreated); group C (model for 6 wk, untreated); group D (model for 6 wk, treated with zinc protoporphyrin IX from week 4 to week 6); group E (model for 6 wk, treated with hemin from week 4 to week 6). A: Heme oxygenase-1 (HO-1) mRNA levels, determined by real-time quantitative polymerase chain reaction; B: HO-1 protein levels, detected by Western blotting. Data are expressed as the mean ± SE (n = 4 per group). aP < 0.01 vs the levels in group A; cP < 0.01 vs the levels in group C.
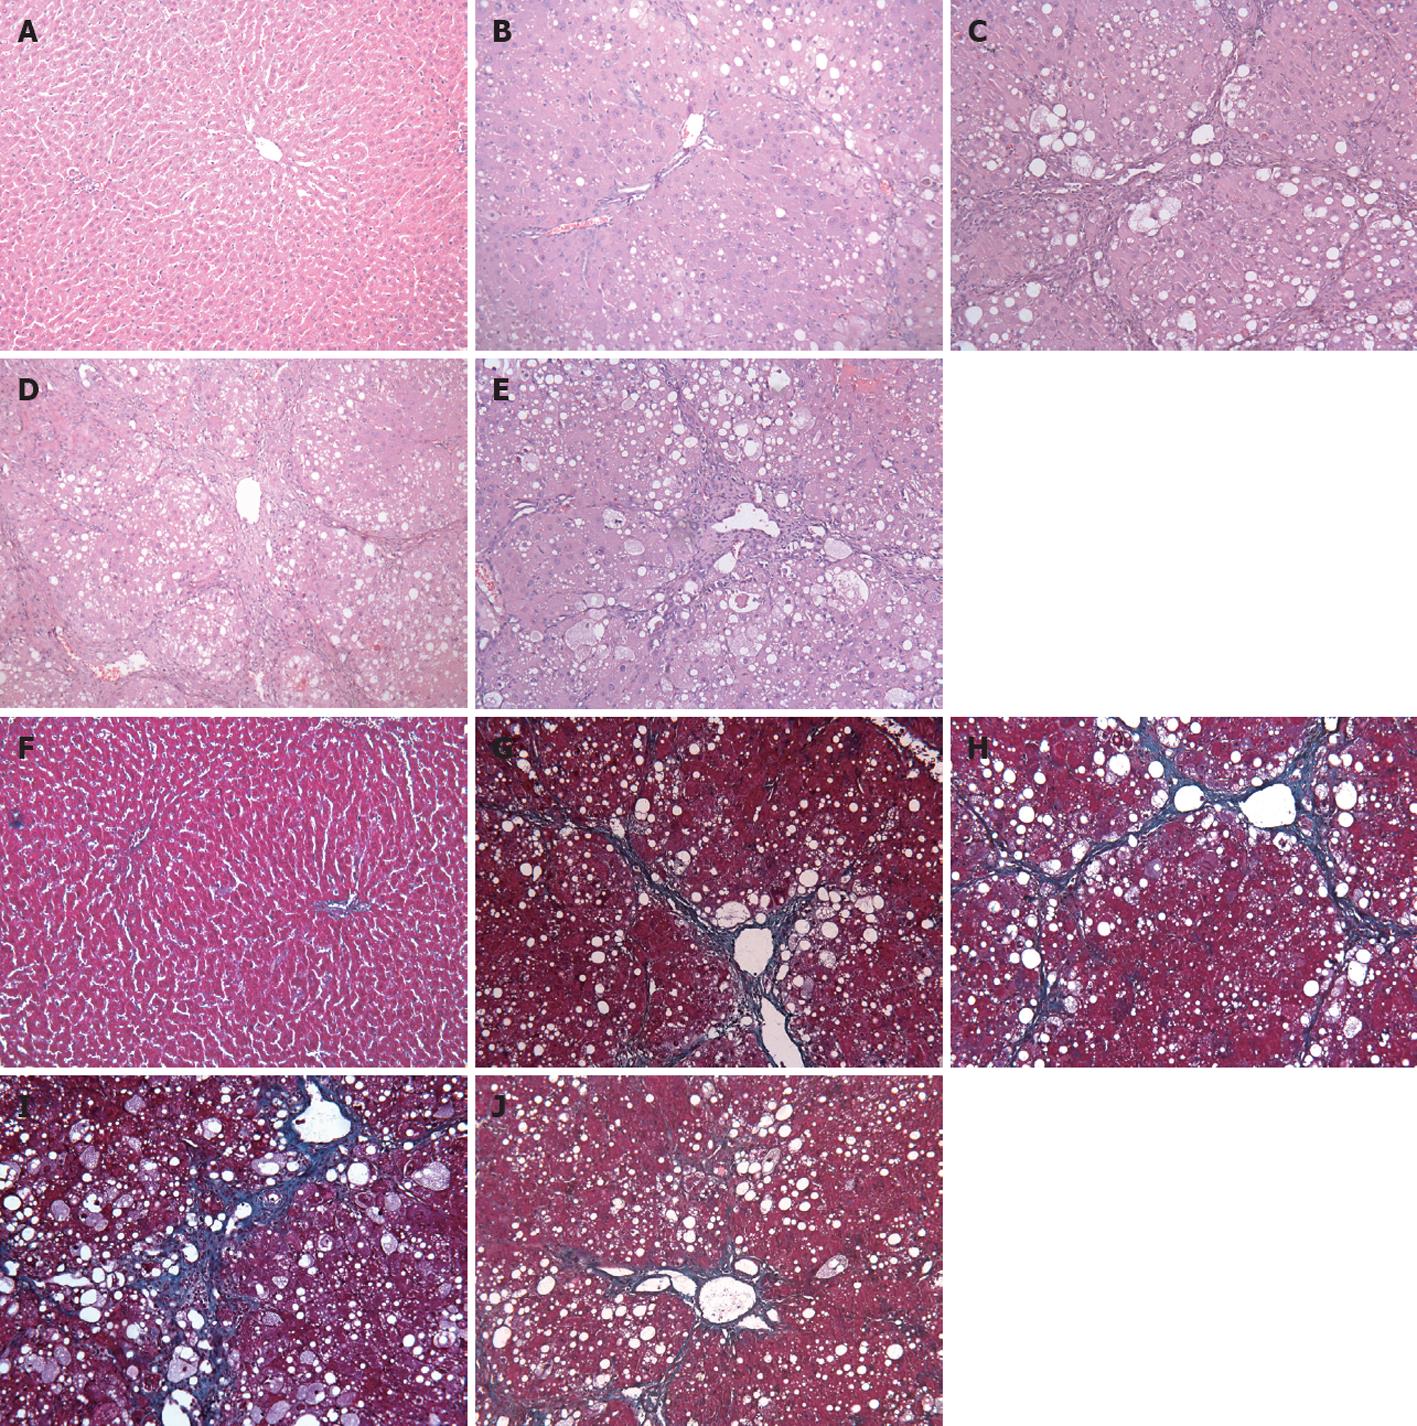
Figure 2 Effects of heme oxygenase-1 on the histopathology of rat liver fibrosis induced by CCl4.
A, F: Group A (normal, untreated); B, G: Group B (model for 4 wk, untreated); C, H: Group C (model for 6 wk, untreated); D, I: Group D (model for 6 wk, treated with zinc protoporphyrin IX from week 4 to week 6); E, J: Group E (model for 6 wk, treated with hemin from week 4 to week 6). A-E: Hematoxylin and eosin staining (magnification × 200); F-J: Masson staining of collagens (magnification × 200).
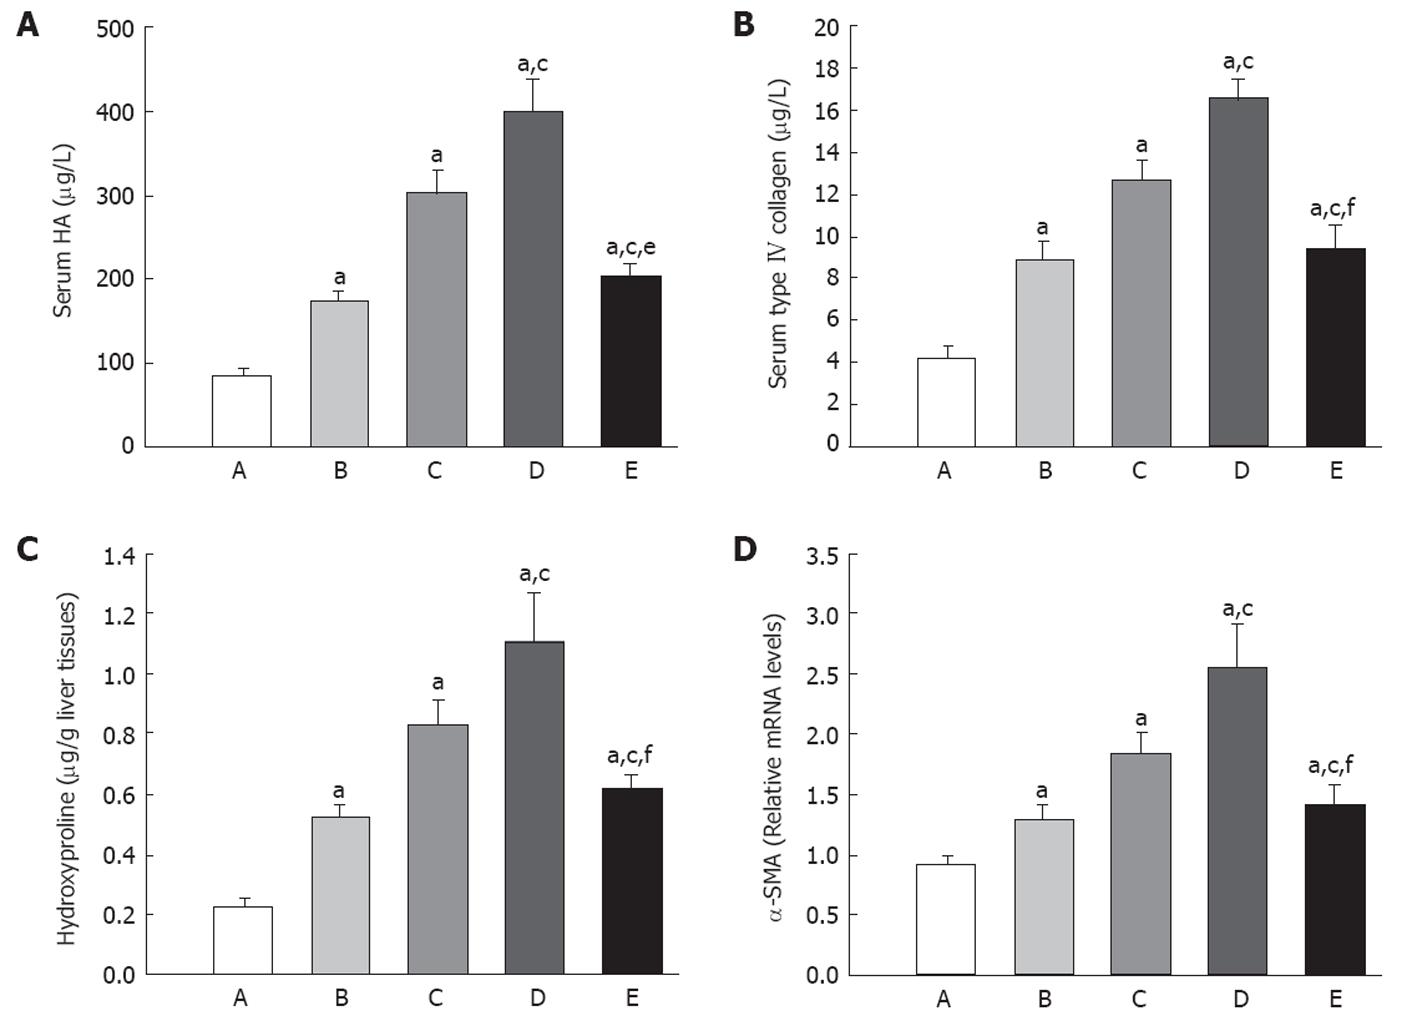
Figure 3 Effects of heme oxygenase-1 on hyaluronate acid, type IV collagen, hydroxyproline and α-smooth muscle actin expression.
A: Levels of serum hyaluronate acid (HA); B: Levels of serum type IV collagen (IV-C); C: Quantity of liver hydroxyproline; D: Levels of liver alpha-smooth muscle actin (α-SMA) mRNA. Values are expressed as mean ± SE. aP < 0.01 vs the levels in group A; cP < 0.01 vs the levels in group C; eP < 0.05 vs the levels in group B; fP > 0.05 vs the levels in group B.
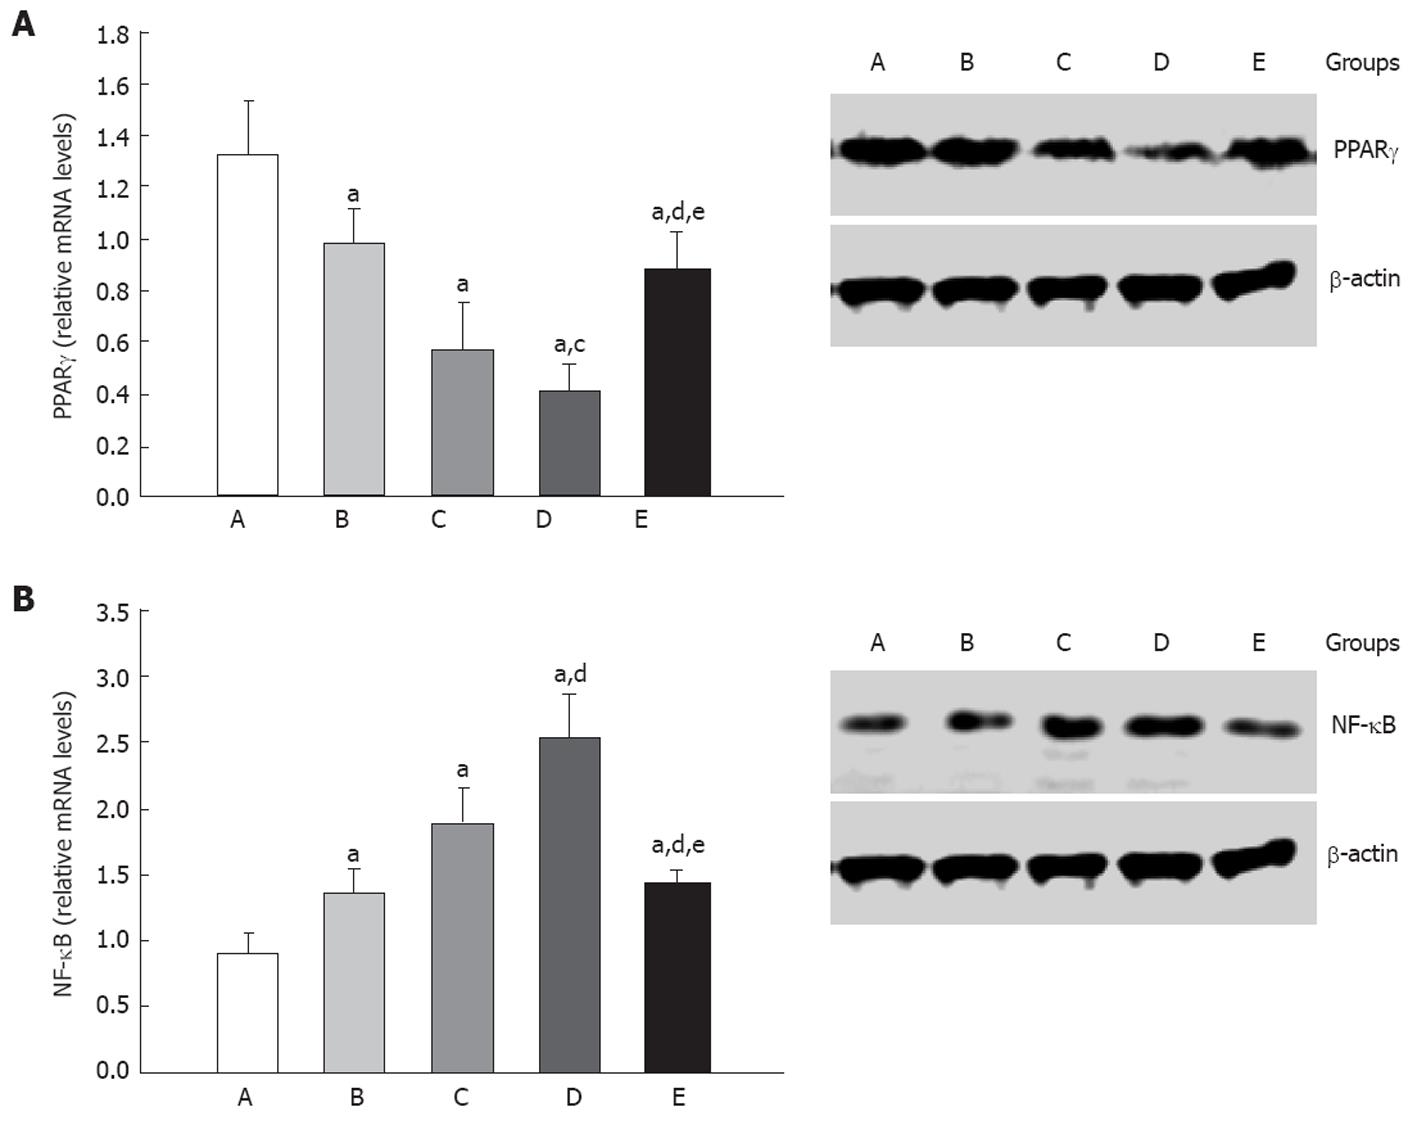
Figure 4 Levels of peroxisome proliferator-activated receptor gamma mRNA and nuclear factor-kappa B mRNA in rat liver analyzed by real-time polymerase chain reaction assay and associated protein assessed by Western blotting.
A: Peroxisome proliferator-activated receptor gamma (PPARγ) mRNA and protein. The molecular weight of PPARγ is 55 kD; B: Nuclear factor-kappa B (NF-κB) mRNA and protein. The molecular weight of NF-κB is 50 kD. β-Actin was used as an invariant control. Values are expressed as mean ± SE (n = 4 per group). aP < 0.01 vs the levels in group A; cP < 0.05 vs the levels in group C; dP < 0.01 vs the levels in group C; eP < 0.01 vs the levels in group D. Control for equal loading.
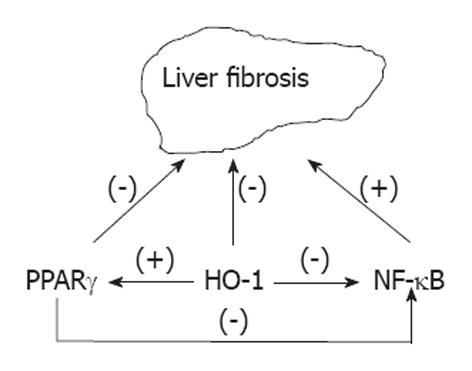
Figure 5 The regulatory pathway between heme oxygenase-1 and peroxisome proliferator-activated receptor gamma or nuclear factor-kappa B in liver fibrosis of rats.
(+) indicate promoting; (-) indicate inhibiting. PPARγ: Peroxisome proliferator-activated receptor gamma; HO-1: Heme oxygenase-1; NF-κB: Nuclear factor-kappa B.
- Citation: Yang H, Zhao LF, Zhao ZF, Wang Y, Zhao JJ, Zhang L. Heme oxygenase-1 prevents liver fibrosis in rats by regulating the expression of PPARγ and NF-κB. World J Gastroenterol 2012; 18(14): 1680-1688
- URL: https://www.wjgnet.com/1007-9327/full/v18/i14/1680.htm
- DOI: https://dx.doi.org/10.3748/wjg.v18.i14.1680


