Copyright
©2012 Baishideng Publishing Group Co.
World J Gastroenterol. Apr 7, 2012; 18(13): 1459-1469
Published online Apr 7, 2012. doi: 10.3748/wjg.v18.i13.1459
Published online Apr 7, 2012. doi: 10.3748/wjg.v18.i13.1459
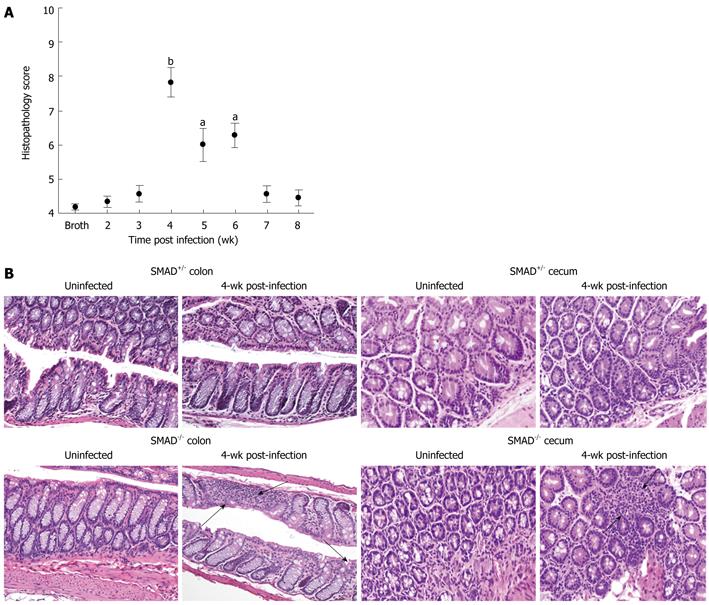
Figure 1 Drosophila mothers against decapentaplegic 3-/- mice are more susceptible to colitis following infection with Helicobacter hepaticus.
A: Inflammation and dysplasia scores in drosophila mothers against decapentaplegic (SMAD)3-/- mice post-infection (wk). The colon and cecum from each animal were given a separate score for inflammation and dysplasia (n = 30 animals/trt). Each animal received a total of four numerical scores for each of these criteria. The figure displays the average total of these scores with a lowest possible score of 4 and a highest possible of 16. aP < 0.05, bP < 0.001 vs control animals. There was no change in colitis scores among SMAD3+/- mice throughout the course of infection (data not shown); B: Hematoxylin and eosin-stained sections from the cecum and colon of SMAD3+/- (upper panel) and SMAD3-/- mice (lower panel) comparing uninfected and 4 wk after infection with Helicobacter hepaticus (H. hepaticus). Four weeks following infection, the number of inflammatory cells and primarily lymphocytes in the lamina propria was slightly increased in both tissues, consistent with mild inflammation (arrows denote infiltrate).
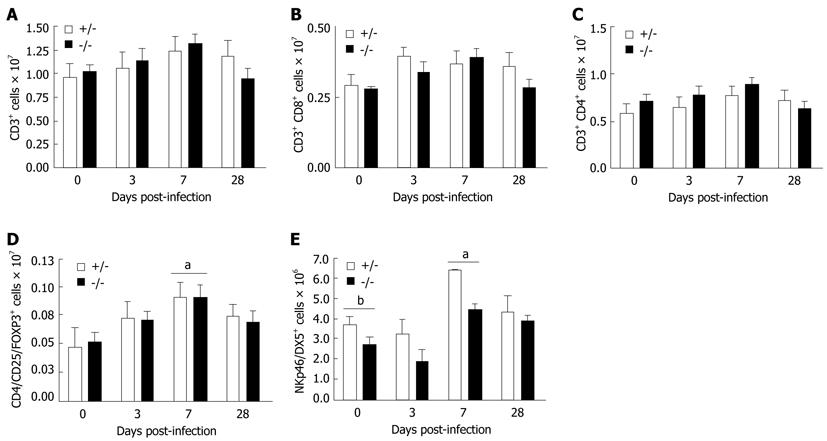
Figure 2 Changes in T lymphocyte populations and natural killer cells in the spleen of drosophila mothers against decapentaplegic 3+/- and drosophila mothers against decapentaplegic-/- mice following infection with Helicobacter hepaticus.
Flow cytometric analysis of lymphocyte populations at days 0, 3, 7 and 28 post-infection. Gates were drawn on viable cells using forward scatter vs side scatter parameters. A: Total CD3+ lymphocytes gated on forward scatter vs CD3; B: Total CD8+ lymphocytes gated on CD3+ lymphocytes; C: Total CD4+ lymphocytes gated on CD3+ lymphocytes; D: Total CD25+/FOXP3+ Treg cells gated on CD3+/CD4+ lymphocytes; E: Total natural killer (NK)p46+/DX5+ NK cells in spleen tissue (n = 4-6 animals per time point). aP < 0.05 vs baseline values (7 d vs 0 d); bP < 0.05 denotes significance between genotypes [drosophila mothers against decapentaplegic (SMAD)3-/-vs SMAD3+/-].
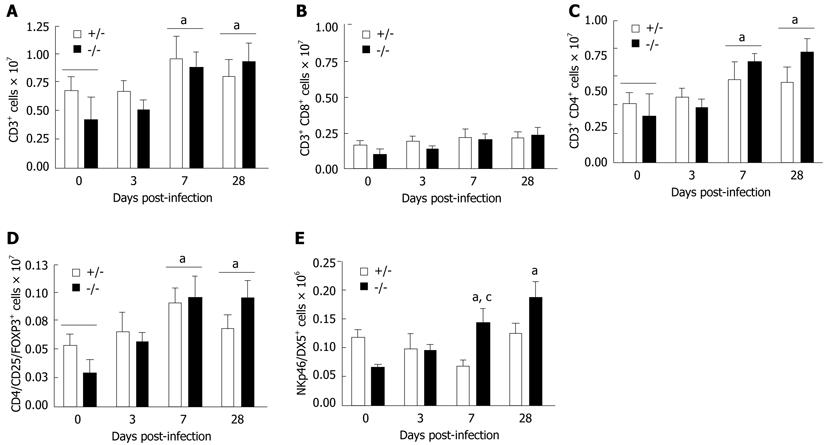
Figure 3 Changes in T lymphocyte populations and natural killer cells in the mesenteric lymph nodes of drosophila mothers against decapentaplegic 3+/- and drosophila mothers against decapentaplegic-/- mice following infection with Helicobacter hepaticus.
Flow cytometric analysis of lymphocyte populations at days 0, 3, 7 and 28 post-infection. Gates were drawn on viable cells using forward scatter vs side scatter parameters. A: Total CD3+ lymphocytes gated on forward scatter vs CD3; B: Total CD8+ lymphocytes gated on CD3+ lymphocytes; C: Total CD4+ lymphocytes gated on CD3+ lymphocytes; D: Total CD25+/FOXP3+ Treg cells gated on CD3+/CD4+ lymphocytes; E: Total natural killer (NK)p46+/DX5+ NK cells in mesenteric lymph nodes (n = 4-6 animals per time point). aP < 0.05 vs baseline values; cP < 0.05 denotes significant interaction between genotypes [drosophila mothers against decapentaplegic (SMAD)3-/-vs SMAD3+/-].
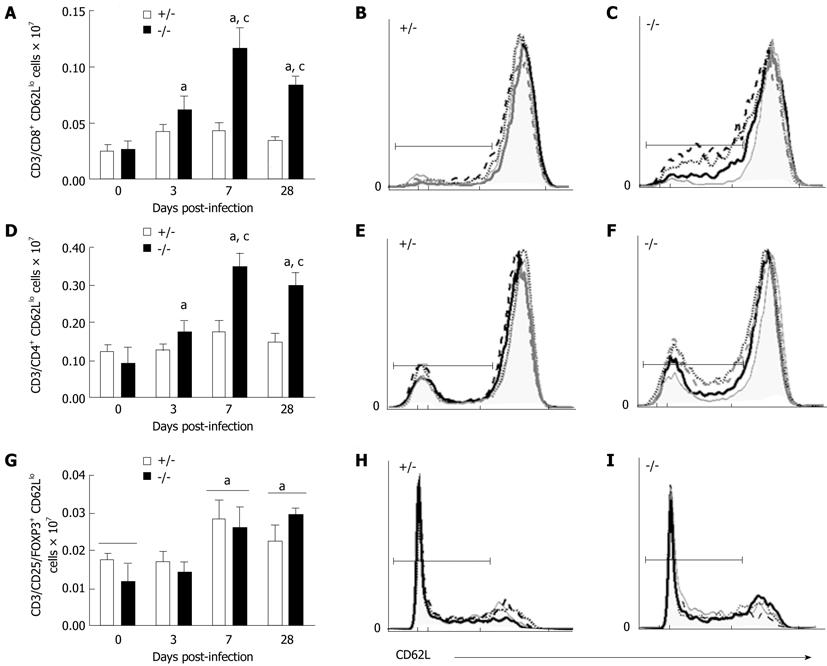
Figure 4 Changes in effector T lymphocyte populations in the mesenteric lymph nodes of drosophila mothers against decapentaplegic 3+/- and drosophila mothers against decapentaplegic-/- mice following infection with Helicobacter hepaticus.
Flow cytometric analysis of lymphocyte populations at days 0, 3, 7 and 28 post-infection. Gates were drawn on viable cells using forward scatter vs side scatter parameters. Histograms represent CD62L expression at 0 d (solid grey), 3 d (dotted black), 7 d (dashed black) and 28 d (solid black) post-infection. Y-axis represents relative cell frequency. X-axis is CD62L expression. Brackets indicate CD62Llo gate used to determine cell percentages. A: Total CD8+ CD62Llo lymphocytes gated on CD3+/CD8+ lymphocytes; B: CD62L expression in drosophila mothers against decapentaplegic (SMAD)3+/- CD8+ lymphocytes; C: CD62L expression in SMAD3-/- CD8+ lymphocytes; D: Total CD4+ CD62Llo lymphocytes gated on CD3+/CD4+ lymphocytes; E: CD62L expression in SMAD3+/- CD4+ lymphocytes; F: CD62L expression in SMAD3-/- CD4+ lymphocytes; G: Total CD25+/FOXP3+ CD62Llo Treg cells gated on CD3+/CD4+ lymphocytes (n = 4-6 animals per time point); H: CD62L expression in SMAD3+/- CD25+/FOXP3+ lymphocytes; I: CD62L expression in SMAD3-/- CD25+/FOXP3+ lymphocytes. aP < 0.05 vs baseline values; cP < 0.01 denotes significant interaction between genotypes (SMAD3-/-vs SMAD3+/–).
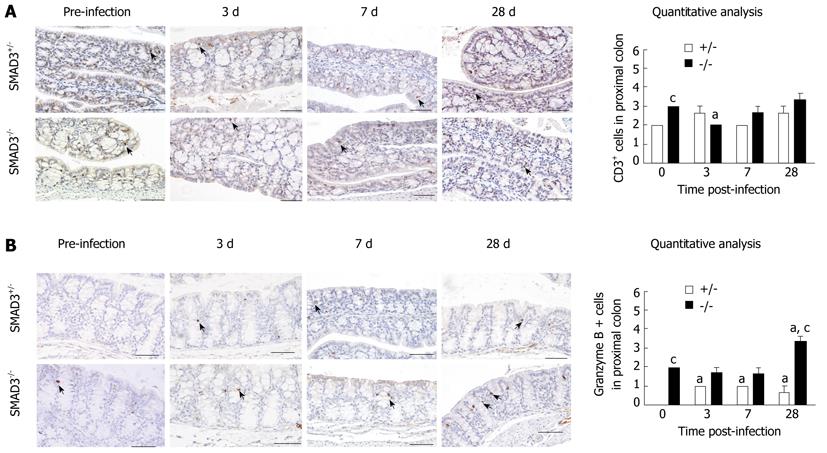
Figure 5 Immunohistochemical staining for (A) CD3 lymphocytes and (B) granzyme B in proximal colon tissue of drosophila mothers against decapentaplegic 3+/- and drosophila mothers against decapentaplegic-/- mice following infection with Helicobacter hepaticus.
aP < 0.05 vs baseline values; cP < 0.01 denotes significant interaction between genotypes [drosophila mothers against decapentaplegic (SMAD)3-/-vs SMAD3+/-] (n = 4-5 animals per stain). Arrows denote areas of positive staining. Scale bars represent 100 μm.
-
Citation: McCaskey SJ, Rondini EA, Clinthorne JF, Langohr IM, Gardner EM, Fenton JI. Increased presence of effector lymphocytes during
Helicobacter hepaticus -induced colitis. World J Gastroenterol 2012; 18(13): 1459-1469 - URL: https://www.wjgnet.com/1007-9327/full/v18/i13/1459.htm
- DOI: https://dx.doi.org/10.3748/wjg.v18.i13.1459


