Copyright
©2012 Baishideng Publishing Group Co.
World J Gastroenterol. Apr 7, 2012; 18(13): 1438-1447
Published online Apr 7, 2012. doi: 10.3748/wjg.v18.i13.1438
Published online Apr 7, 2012. doi: 10.3748/wjg.v18.i13.1438
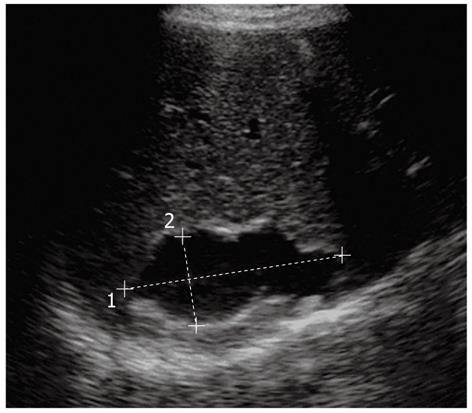
Figure 1 Liver hydatid disease in a 50-year-old man appears as a well-defined anechoic mass without hydatid sand and septa (type I).
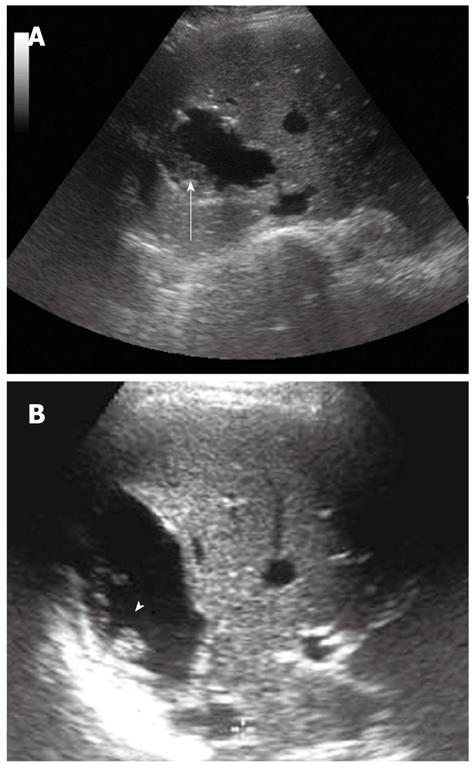
Figure 2 Liver hydatidosis in a 27-year-old female.
Ultrasonography images (A, B) show a lesion with mixed echogenicity, with hydatid sand (the arrow) and multiple echogenic foci (the arrowhead).
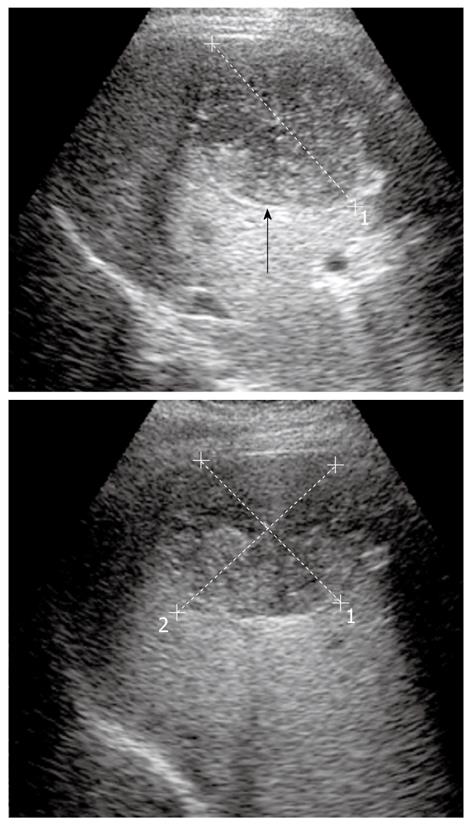
Figure 3 Ultrasonography images of hydatid disease show multiple internal septa and floating membranes inside the cyst.
Note the cyst wall is visible as double echogenic lines (see the black arrow).
Figure 4 Calcified unilocular hydatid cyst.
Digital scout image (A) shows a round, densely calcified lesion supra-elevating the right diaphragm. Computed tomography basal (B) and contrast-enhanced (C) images reveal a hypoattenuating lesion with peripheral wall calcification in the right lobe. Membranes appear as serpentine linear structures. Note the complex ultrasonography aspect of the cyst and the hyperechoic wall.
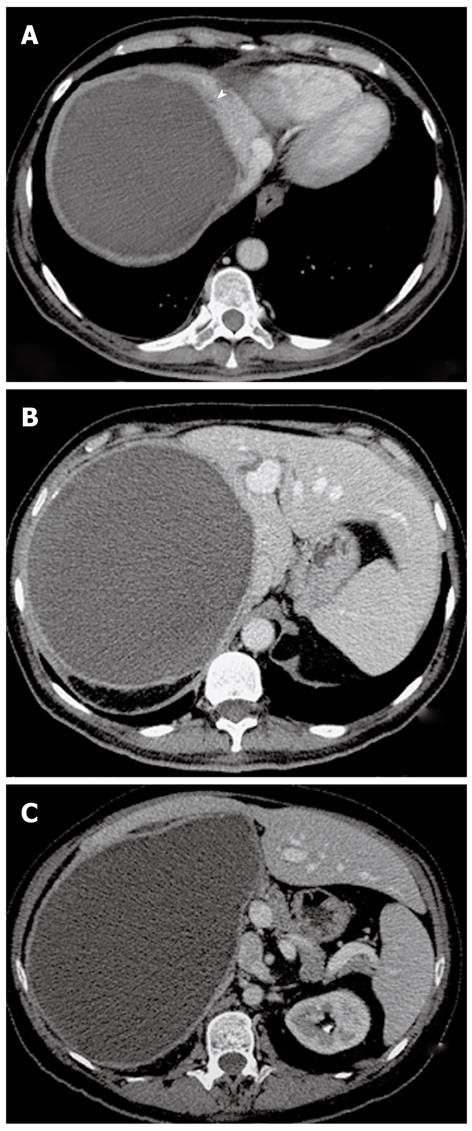
Figure 5 Computed tomography scan shows a huge nonenhancing mass with regular contours and thickened wall representing the pericyst (the white arrowhead) occupying all the right lobe of the liver (type I); either the right portal vein or the right hepatic vein is completely replaced.
Figure 6 Computed tomography scan (A, B, C, D) shows some unenhanced hypoattuenuating masses with well defined borders occupying the right lobe of the liver; multiple round daughter cysts are seen peripherally inside the lesion (type II).
Note the “rosette appearance”.
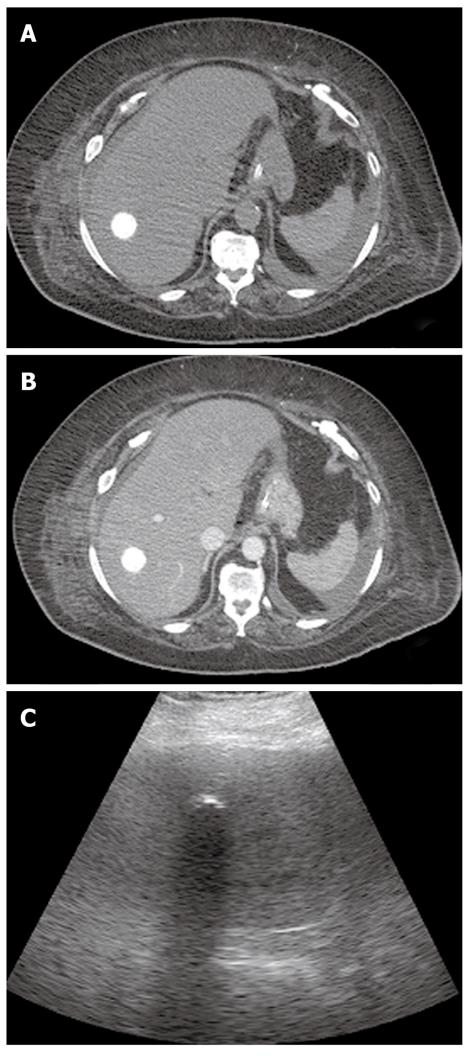
Figure 7 Seventy-three year-old-woman with a dead hydatid cyst.
Computed tomography scan basal and enhanced images (A, B) show a totally calcified cyst (type III). At ultrasonography (C) calcified cyst shows strong posterior shadowing.
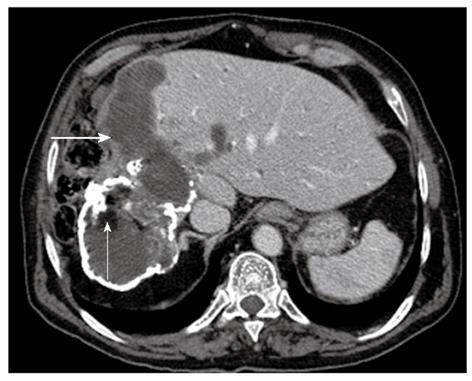
Figure 8 Contrast-enhanced upper abdominal computed tomography scan demonstrates a partially calcified hydatid cyst in direct communication with the biliary tree markedly dilated (the bold white arrow).
The presence of fat components within the cyst derives from the lipid elements in bile (the thin white arrow) (type IV).
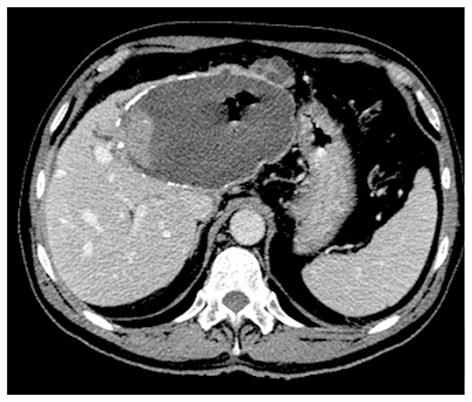
Figure 9 Fifty-five-year-old male with acute abdominal pain, fever and leukocytosis.
Contrast-enhanced computed tomography shows intracystic gas in the anterior part of a unilocular partially calcified hydatid cyst, suggesting super-infection; finding confirmed at surgery (type IV).
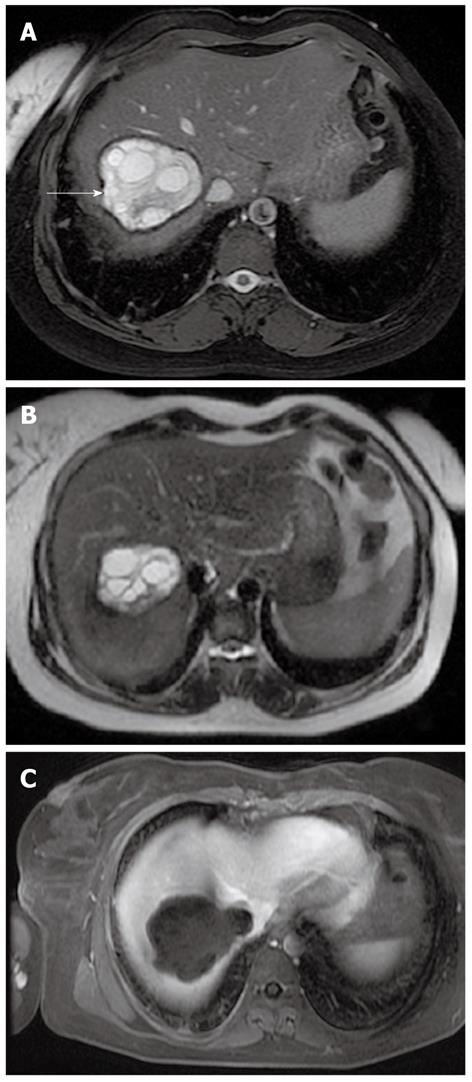
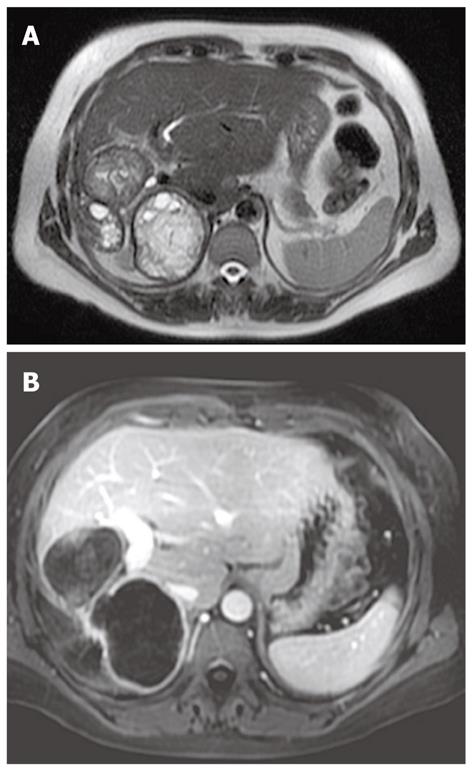
Figure 10 Axial T1-weighted (A) and T2-weighted (B) images show a well defined cystic lesion and the typical peripheral location of the daughter cysts within the mother cyst.
Note the marked hypointensity of the pericyst (the white arrow). After contrast administration (C) the cystic lesion does not show contrast enhancement (type II).
Figure 11 Axial T2-weighted and post-contrast images show the exophytic growth of hydatid cyst (type II) (A).
After the injection of contrast media the septa and cyst wall enhance (B). Note the proximity of the cyst to the diaphragm which facilitates transdiaphragmatic thoracic involvement and to main portal vein.
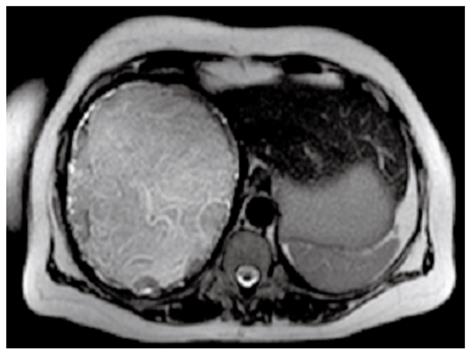
Figure 12 35-year-old woman living in an endemic region.
Axial T2-weighted magnetic resonance image show the hydatid cyst that occupies almost the entire right lobe of the liver with thickened pericyst and multiple floating membranes inside the lesion (type II).
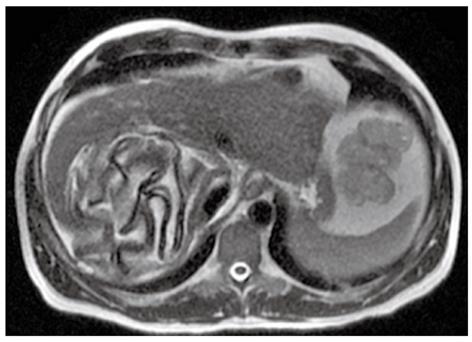
Figure 13 The detachment of the pericyst and the collapsed membranes inside the cyst due to damage or degeneration may give the hydatid cyst a serpentine linear aspect; this is the “snake sign”.
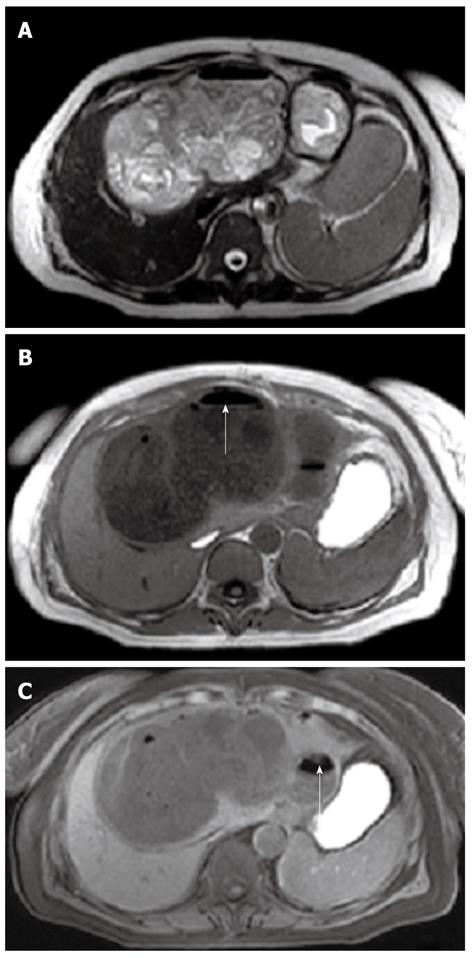
Figure 14 Axial T2-weighted (A) and T1-weighted (B, C) magnetic resonance images demonstrate a round, cystic lesion in the left hepatic lobe, with thickened pericyst, small daughter cysts, floating membranes and an air-fluid level within the cyst (white arrow).
The diagnosis is an infected hydatid cyst (type IV).
Figure 15 T1 coronal image and T2 axial image show a huge and multilocular hydatid cyst occupying the entire left lobe, partially the right lobe (A, B) and protruding into the hepatic hilum.
Magnetic resonance cholangiopancreatography (MRCP) sequences show the compression of the common bile duct at the confluence and of the right hepatic duct (the white arrowhead) and the consequent intrahepatic biliary tree dilatation (the white arrows) (C, D).
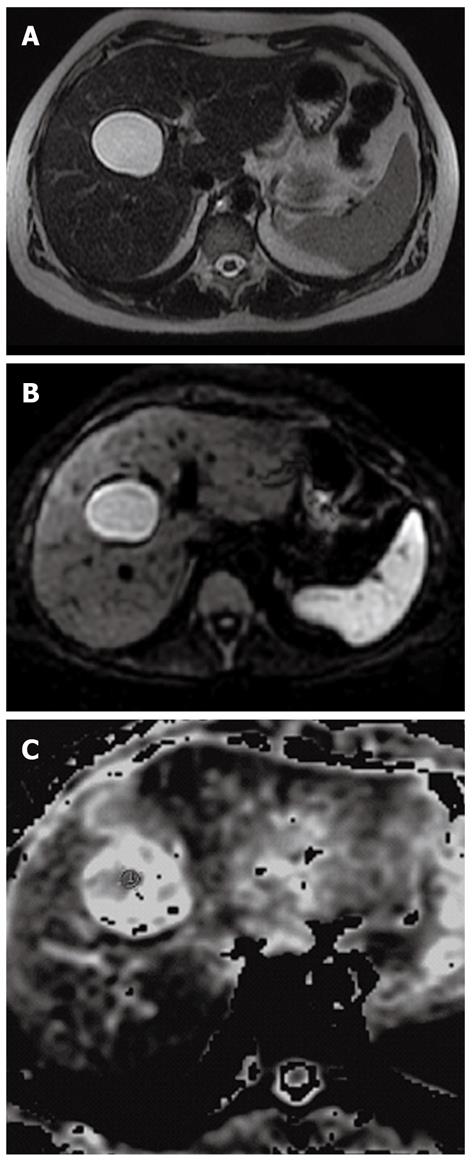
Figure 16 A type I hydatid cyst.
A: Axial T2 weighted magnetic resonance image depicts a round cystic mass in the anterior segment of the right lobe, with no septa or solid portions; B: On the diffusion-weighted image the lesion exhibits high signal intensity (b = 1000); C: On apparent diffusion coefficient map, apparent diffusion coefficient value is 2.4 x 10⁻³.
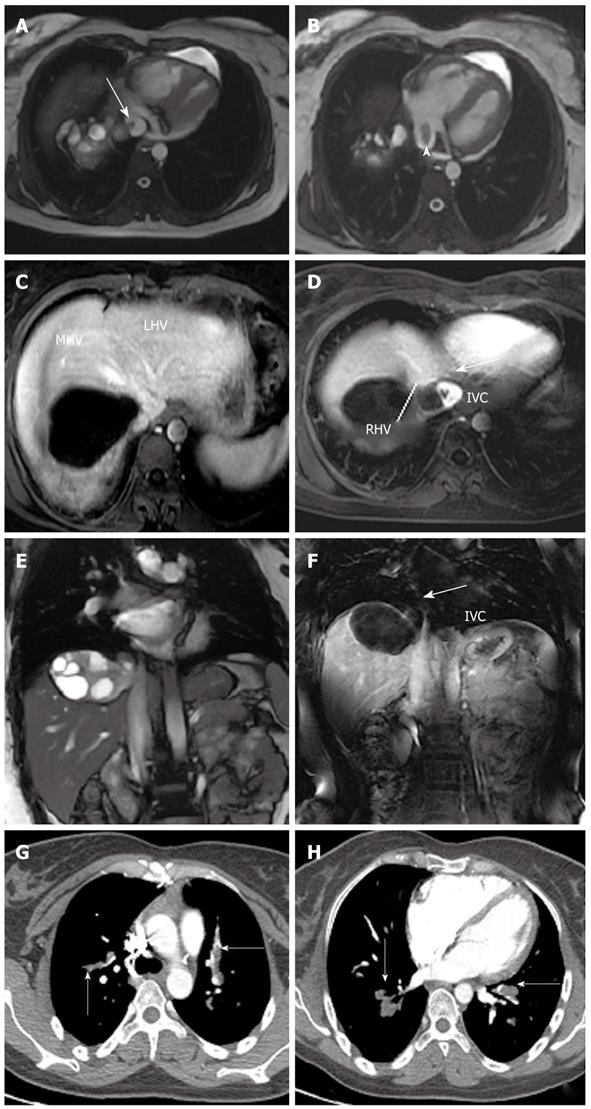
Figure 17 Hepatic hydatidosis in a 30-year-old woman who presented with short of breath, fatigue and edema to the lower limbs.
Magnetic resonance (MR) steady-state-free-precession sequences (A, B, E) and MR angiography (C, D, F) images showed the hydatid cyst invading the right hepatic vein (RHV), protruding in the inferior vein cava (IVC) (the bold white arrow) and in the right atrium (the white arrowhead). The mid hepatic vein (MHV) and the left hepatic vein (LHV) were normally patent (C). The multidetector computed tomography-angiography revealed diffuse pulmonary parasitic embolism (the thin white arrows) (G, H).
- Citation: Marrone G, Crino' F, Caruso S, Mamone G, Carollo V, Milazzo M, Gruttadauria S, Luca A, Gridelli B. Multidisciplinary imaging of liver hydatidosis. World J Gastroenterol 2012; 18(13): 1438-1447
- URL: https://www.wjgnet.com/1007-9327/full/v18/i13/1438.htm
- DOI: https://dx.doi.org/10.3748/wjg.v18.i13.1438


