Copyright
©2012 Baishideng Publishing Group Co.
World J Gastroenterol. Mar 28, 2012; 18(12): 1319-1327
Published online Mar 28, 2012. doi: 10.3748/wjg.v18.i12.1319
Published online Mar 28, 2012. doi: 10.3748/wjg.v18.i12.1319
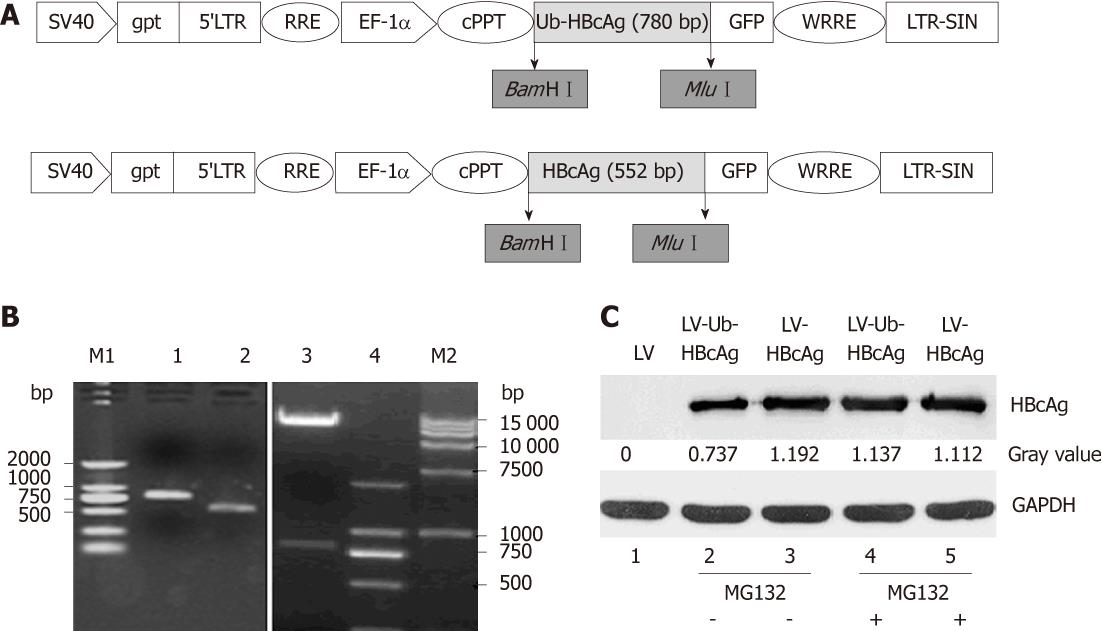
Figure 1 Schematic diagram, electrophoresis of ubiquitinated hepatitis B virus core antigen and HBcAg genes, pWPXLd-Ub-HBcAg digested by BamHIand MluI, and HBcAg protein expression (about 21 kDa).
A: Schematic diagram of pWPXLd vector; B: Lane 1, ubiquitinated hepatitis B virus core antigen (Ub-HBcAg) polymerase chain reaction (PCR) product (780 bp); lane 2, HBcAg PCR product (552 bp); lane 3, The digested products pWPXLd-Ub-HBcAg by BamHI and MluI; lane 4 and lane M1, DNA marker 2000; lane M2, DNA marker 15 000; C: 293T cells were transduced with lentiviral vector (LV), LV-Ub-HBcAg or LV-HBcAg and cultured for 48 h. MG-132 (10 mmol) was added for 24 h before harvesting the cells. Cell lysates (10 mg) were analyzed by immunoblotting with an anti-HBc antibody. Relative expression of HBcAg was calculated by a gray value.
Figure 2 Transduction of dendritic cells with lentiviral vectors expressing green fluorescent protein was evaluated by flow cytometry.
Dendritic cells (DCs) were seeded in six-well plates at 1 × 10⁶ cells/well. Lentiviral vectors ubiquitinated hepatitis B virus core antigen (LV-Ub-HBcAg), lentiviral vectors hepatitis B virus core antigen (LV-HBcAg) or lentiviral vector (LV) was added at an multiplicity of infection of 20. GFP: Green fluorescent protein.
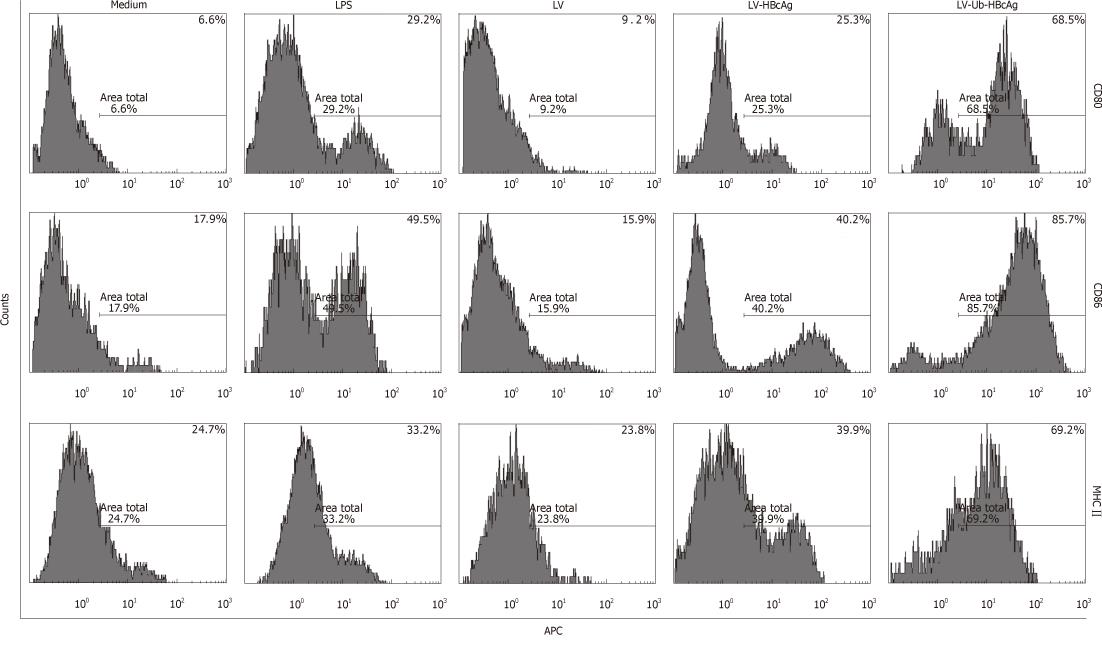
Figure 3 Percentage of dendritic cell surface molecules.
In the lentiviral vectors ubiquitinated hepatitis B virus core antigen (LV-Ub-HBcAg) group, the expression of major histocompatibility complex (MHC) class II, CD80 and CD86 molecules characteristic of dendritic cells (DCs) was significantly higher than that in the lipopolysaccharide (LPS) or lentiviral vectors hepatitis B virus core antigen (LV-HBcAg) group. The results represent one of three experiments. LV: Lentiviral vector; APC: Antigen-presenting cell.
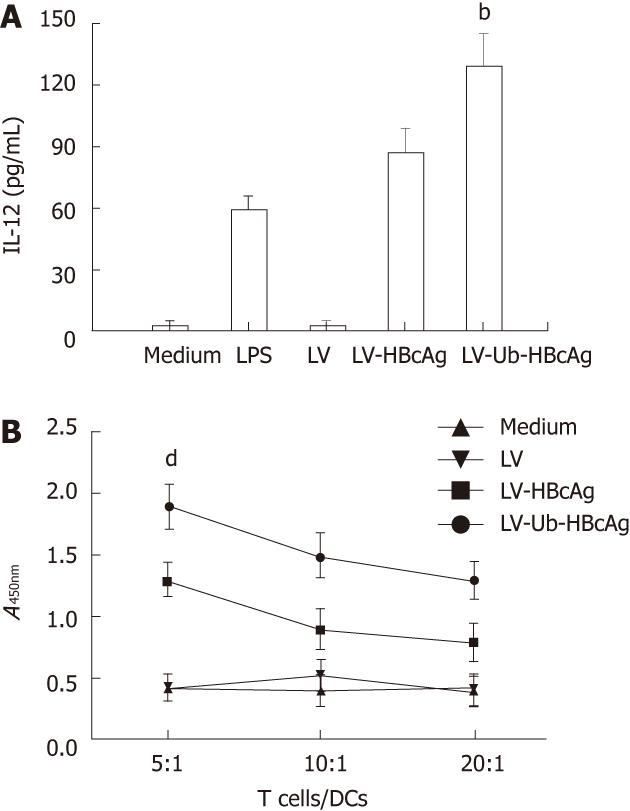
Figure 4 Interleukin-12 secretion of dendritic cells, and detection of the T lymphocyte proliferation response.
A: Interleukin-12 (IL-12) production was measured by enzyme-linked immunosorbent assay. Experiments were repeated in triplicate with similar results. Data shown represent the mean ± SD. bP < 0.01 vs lentiviral vector-encoding hepatitis B virus core antigen (LV-HBcAg) group; B: T cell proliferation ability. All experiments were performed twice under the same conditions. dP < 0.01 vs LV-HBcAg group. DC: Dendritic cell; LV-Ub-HBcAg: Lentiviral vector-encoding ubiquitinated hepatitis B virus core antigen; LV: Lentiviral vector.
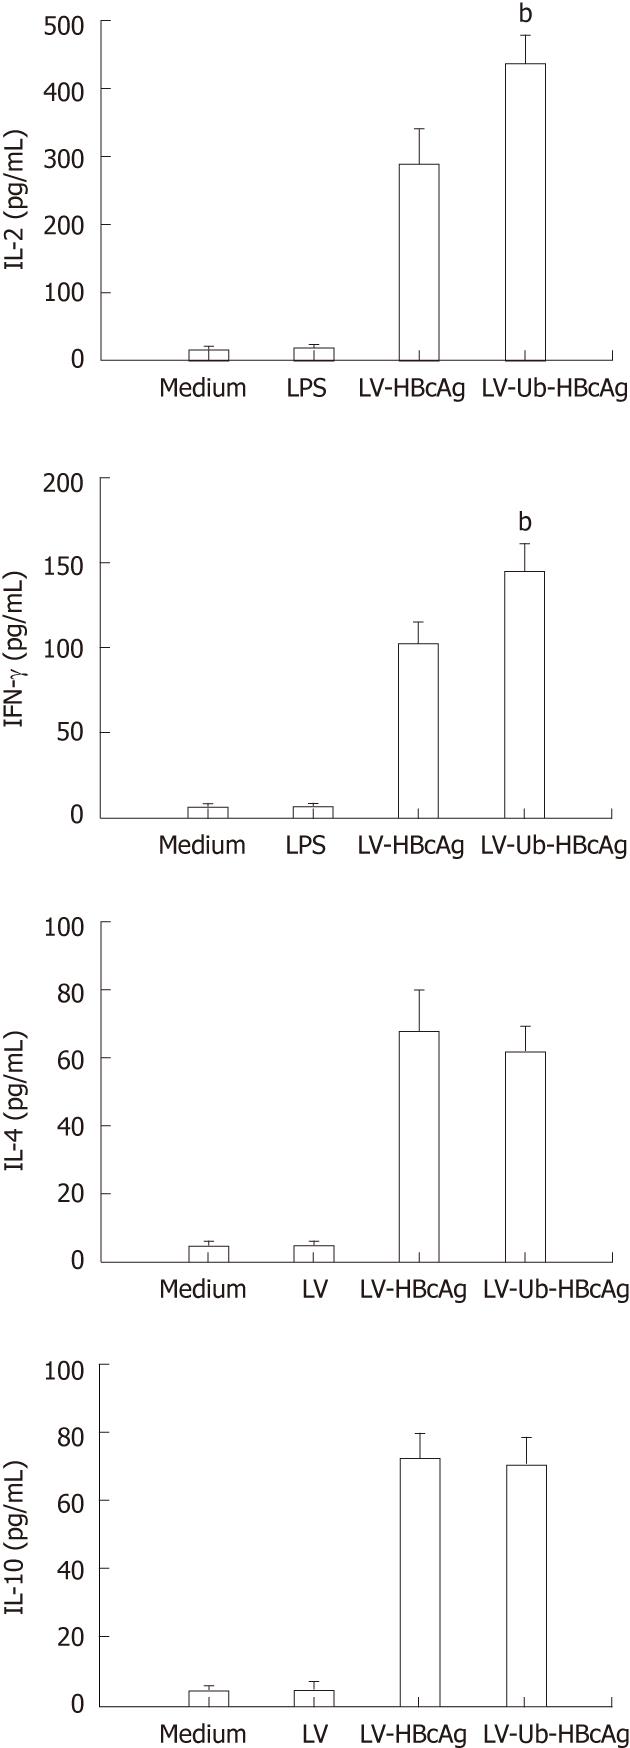
Figure 5 Cytokine production.
Cytokine secretion of proliferative T cells. Data represent the mean ± SD. bP < 0.01 vs lentiviral vector-encoding hepatitis B virus core antigen (LV-HBcAg) group. LV-Ub-HBcAg: Lentiviral vector-encoding ubiquitinated hepatitis B virus core antigen; LV: Lentiviral vector; INF-γ: Interferon-γ; IL: Interleukin.
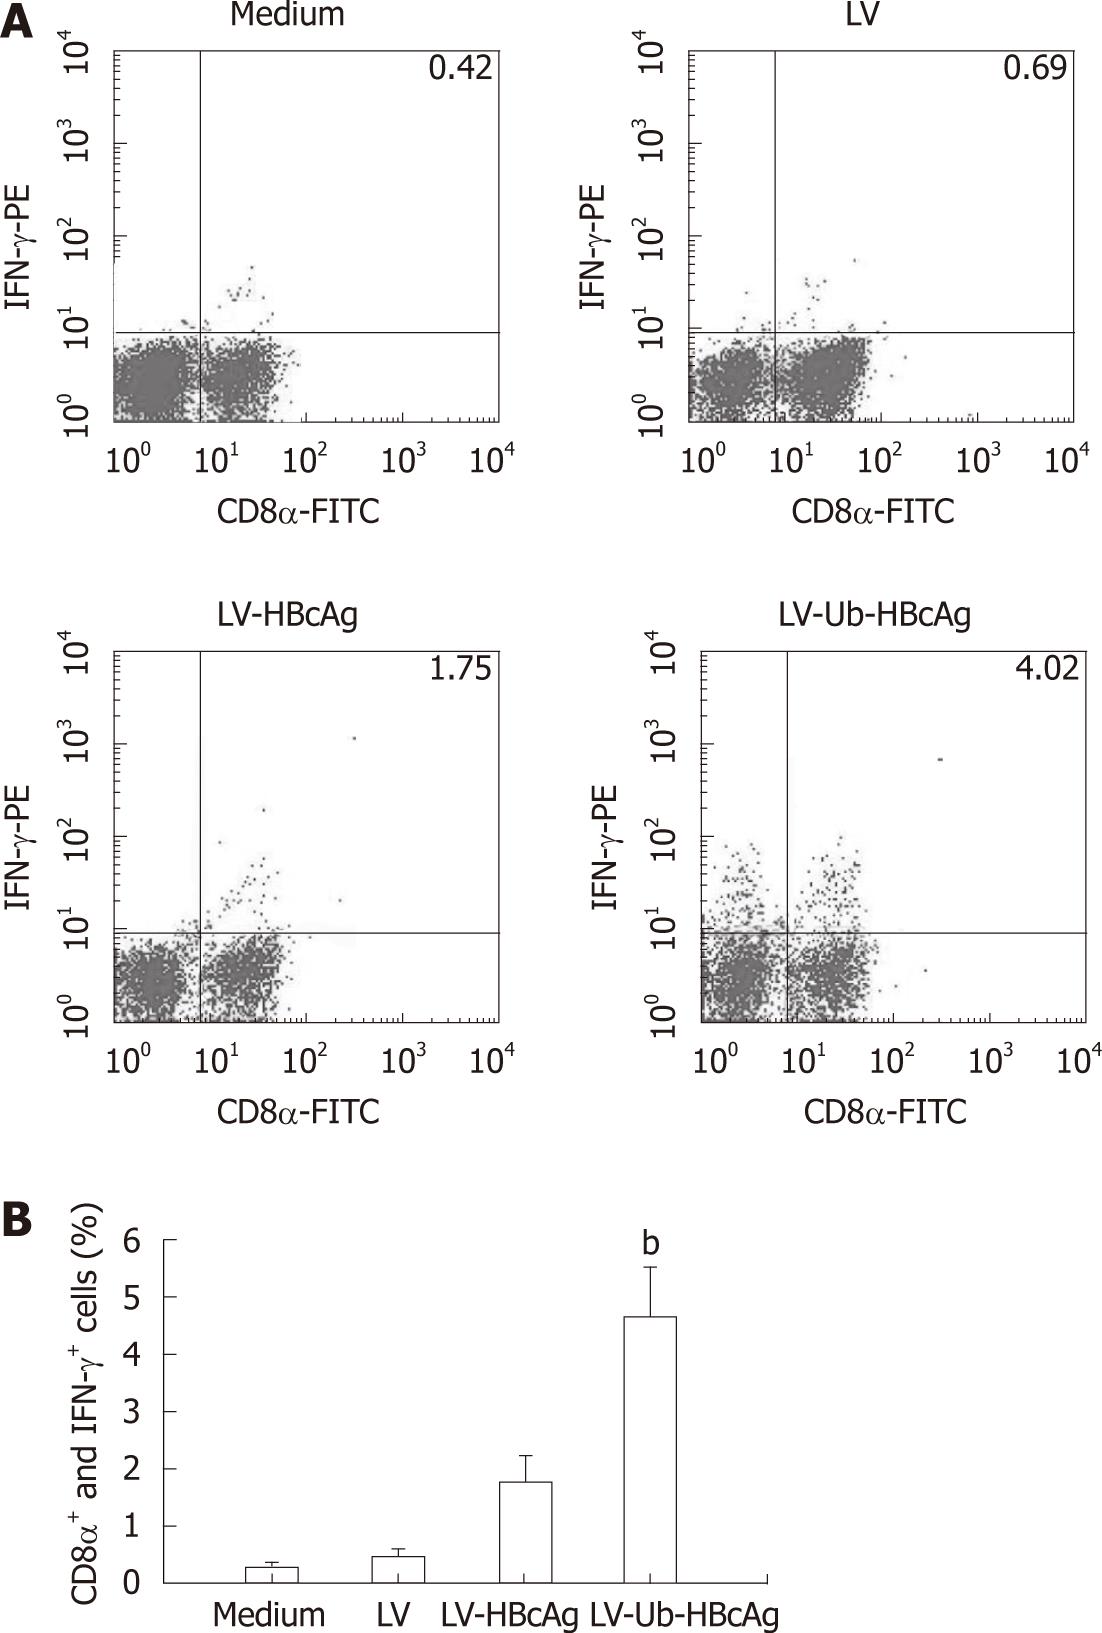
Figure 6 Intracellular cytokine analysis.
A: The proliferative T cells were suspended in complete RPMI 1640 (2 × 10⁶/mL), Intracellular cytokine analysis by flow cytometry using CD8α-FITC and Interferon (IFN)-γ-PE antibodies. The results are representative of one of three experiments; B: The presence of CD8α+ and IFN-γ+ cells . bP < 0.01 vs lentiviral vector-encoding hepatitis B virus core antigen (LV-HBcAg) group. LV-Ub-HBcAg: Lentiviral vector-encoding ubiquitinated hepatitis B virus core antigen; LV-HBcAg: Lentiviral vector-encoding hepatitis B virus core antigen; LV: Lentiviral vector.
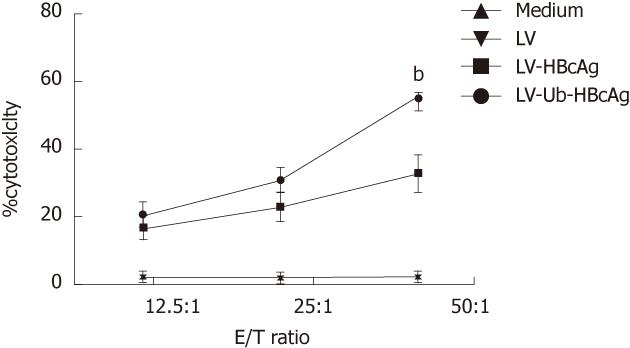
Figure 7 Cytotoxic response of proliferative T cells.
Effector cells were incubated with P815/c at different effector/target (E/T) ratios (12.5:1, 25:1 or 50:1) for 4h. Experiments were repeated three times with similar results. Data represent the mean ± SD. bP < 0.01 vs lentiviral vector-encoding hepatitis B virus core antigen (LV-HBcAg) group. LV-Ub-HBcAg: Lentiviral vector-encoding ubiquitinated hepatitis B virus core antigen; LV: Lentiviral vector.
- Citation: Chen JH, Yu YS, Chen XH, Liu HH, Zang GQ, Tang ZH. Enhancement of CTLs induced by DCs loaded with ubiquitinated hepatitis B virus core antigen. World J Gastroenterol 2012; 18(12): 1319-1327
- URL: https://www.wjgnet.com/1007-9327/full/v18/i12/1319.htm
- DOI: https://dx.doi.org/10.3748/wjg.v18.i12.1319


