Copyright
©2012 Baishideng Publishing Group Co.
World J Gastroenterol. Mar 14, 2012; 18(10): 1038-1047
Published online Mar 14, 2012. doi: 10.3748/wjg.v18.i10.1038
Published online Mar 14, 2012. doi: 10.3748/wjg.v18.i10.1038
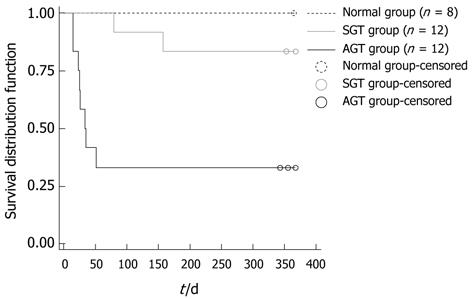
Figure 1 Kaplan-Meier survival curve in the different groups.
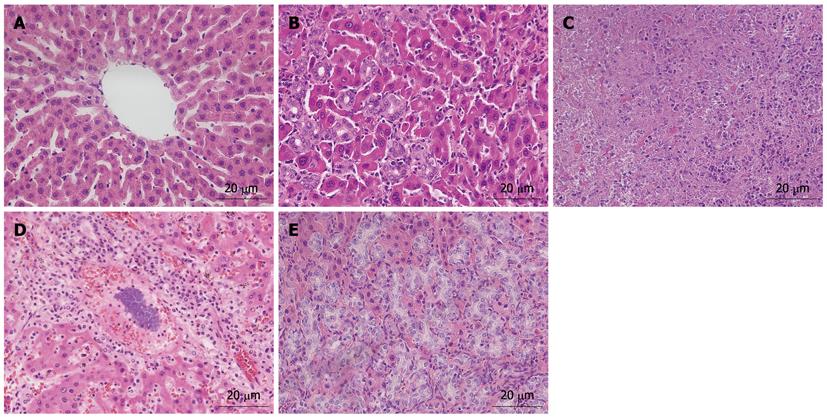
Figure 2 Light micrograph of hepatic histopathology stained with hematoxylin and eosin (HE, × 400).
A: The normal group showed the normal hepatic structure; B: The SGT group revealed the chronic bile duct hyperplasia; C: The AGT group presented hepatic graft necrosis; D: The AGT group showed the infectious hepatic graft; E: The AGT group emerged severe chronic bile duct hyperplasia.
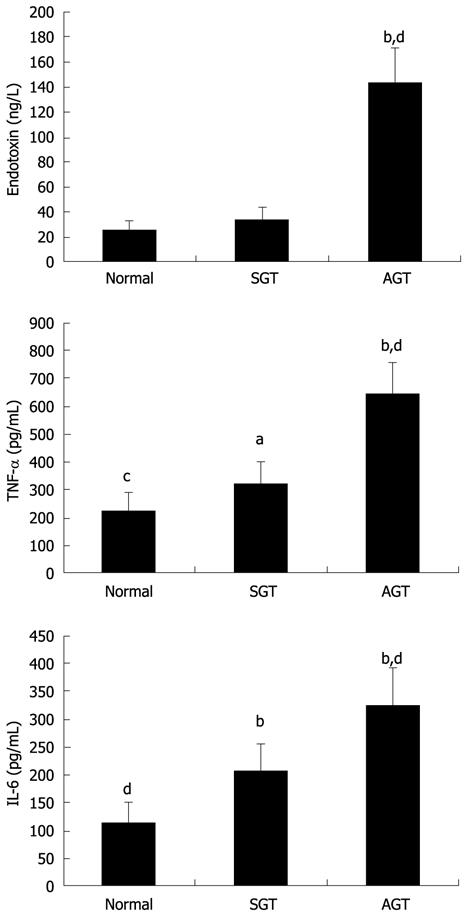
Figure 3 Plasma levels of endotoxin, tumor necrosis factor-α, and interleukin-6 in the different groups on the 21th day after liver transplantation.
Normal group (n = 8); SGT group (n = 8); AGT group (n = 8). aP < 0.05, bP < 0.01 vs Normal group, respectively; cP < 0.05, dP < 0.01 vs SGT group, respectively; P not significant in the remaining parameters. TNF-α: Tumor necrosis factor-α; IL-6: Interleukin-6.
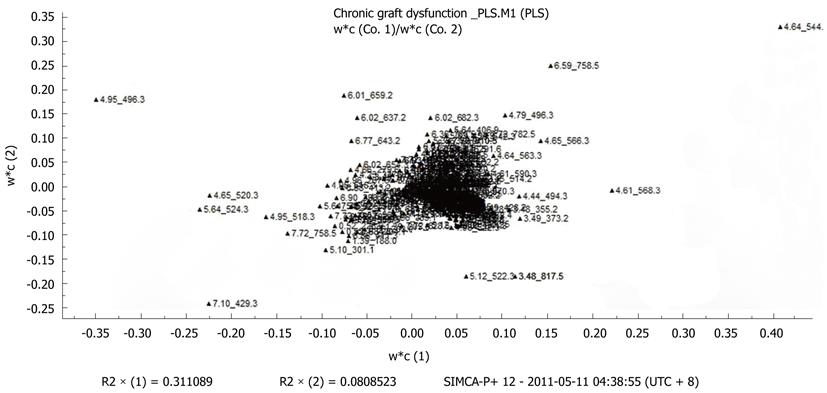
Figure 4 Loading plot of all the different plasma samples.
The marked numbers beside the points were the corresponding retention time and the mass-to-charge ratio (m/z) of each possible biomarkers.
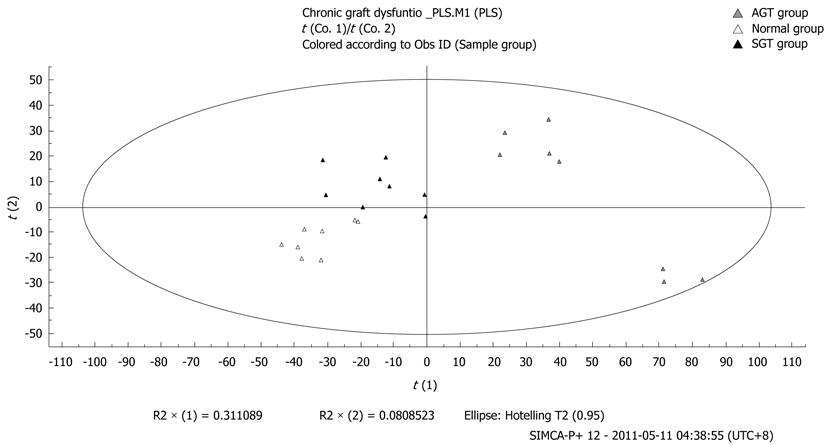
Figure 5 The partial least squares-discriminate analysis scores plot of the different groups.
According to this plot, the metabolic profiles of the SGT and AGT groups deviated from those of the normal group gradually.
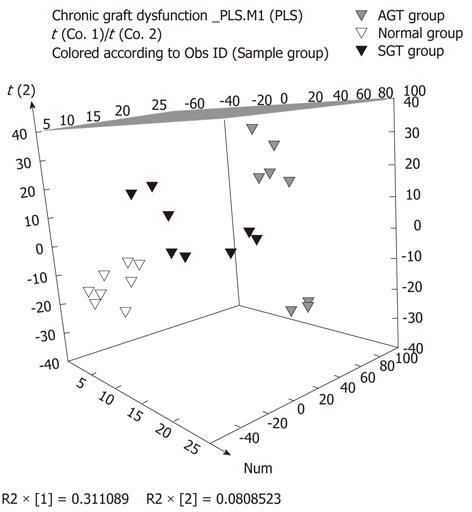
Figure 6 The three-dimensional partial least squares-discriminate analysis scores plot of the different groups.
According to this three-dimensional plot, the metabolic profiles of the AGT groups deviated more than those of the SGT group from those of the normal group. PLS: Partial least squares.
- Citation: Jiang JW, Ren ZG, Cui GY, Zhang Z, Xie HY, Zhou L. Chronic bile duct hyperplasia is a chronic graft dysfunction following liver transplantation. World J Gastroenterol 2012; 18(10): 1038-1047
- URL: https://www.wjgnet.com/1007-9327/full/v18/i10/1038.htm
- DOI: https://dx.doi.org/10.3748/wjg.v18.i10.1038


