
















©2012 Baishideng Publishing Group Co.
World J Gastroenterol. Mar 14, 2012; 18(10): 1038-1047
Published online Mar 14, 2012. doi: 10.3748/wjg.v18.i10.1038
Published online Mar 14, 2012. doi: 10.3748/wjg.v18.i10.1038
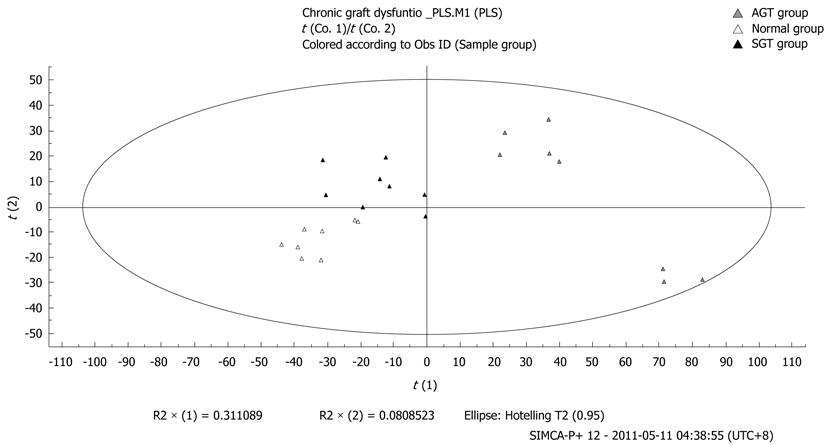
Figure 5 The partial least squares-discriminate analysis scores plot of the different groups.
According to this plot, the metabolic profiles of the SGT and AGT groups deviated from those of the normal group gradually.
- Citation: Jiang JW, Ren ZG, Cui GY, Zhang Z, Xie HY, Zhou L. Chronic bile duct hyperplasia is a chronic graft dysfunction following liver transplantation. World J Gastroenterol 2012; 18(10): 1038-1047
- URL: https://www.wjgnet.com/1007-9327/full/v18/i10/1038.htm
- DOI: https://dx.doi.org/10.3748/wjg.v18.i10.1038