Copyright
©2012 Baishideng Publishing Group Co.
World J Gastroenterol. Jan 7, 2012; 18(1): 90-95
Published online Jan 7, 2012. doi: 10.3748/wjg.v18.i1.90
Published online Jan 7, 2012. doi: 10.3748/wjg.v18.i1.90
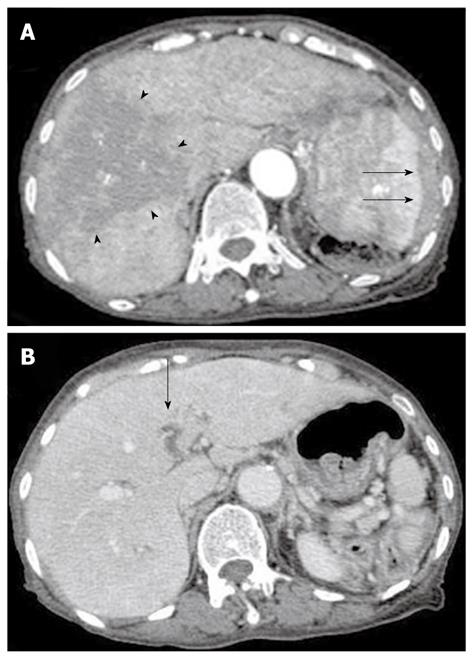
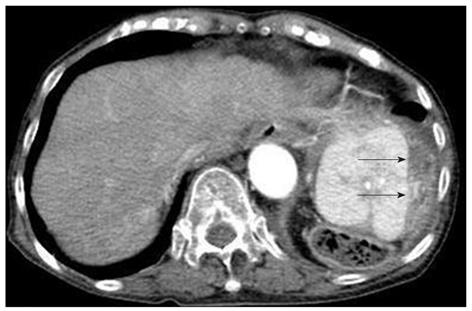
Figure 1 Contrast computed tomography scanning of the arterial phase revealed a diffusely and non-homogeneously enhanced liver, with the anterior compartment showing less enhancement (arrow-head).
The spleen was found to be protruding inward, and also showed a diffuse and inhomogeneous enhancement. A: Computed tomography (CT) scans also revealed a soft density layer around the spleen (arrow). B: A CT of the portal phase showed an occlusion (arrow) of the left branch of the portal vein.
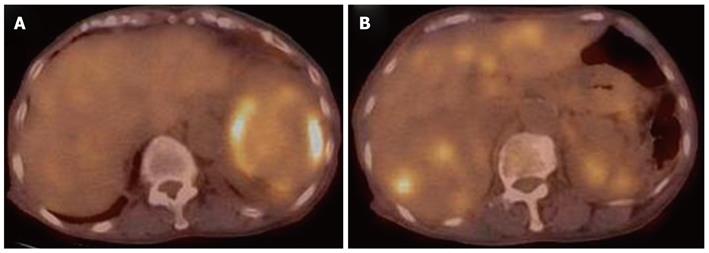
Figure 2 Fluorodeoxyglucose positron emission tomography/computed tomography analysis showing abnormal metabolic activity with a high standardized uptake value of 7.
1 surrounding the spleen (A), and multiple abnormal uptakes in segment six of the liver (B).
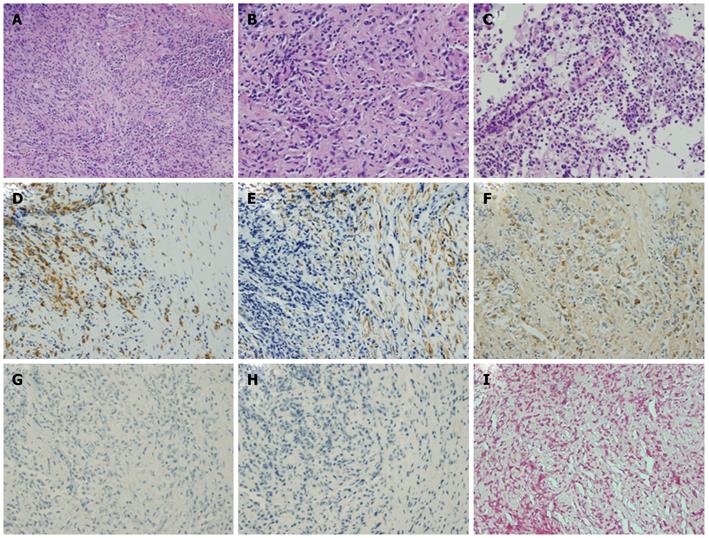
Figure 3 Histological findings for the liver via hematoxylin and eosin staining showing patchy fibroses and inflammatory cell infiltration (original magnification × 100).
A: Mainly consisting of lymphocytes and plasma cells (original magnification × 200); B and C: Histological findings for the spleen following HE staining showed infiltration by plasma cells (original magnification × 200); D-I: Immunohistochemical analysis of the liver showed that the lesion was positive for CD68 (D), α-smooth muscle actin (SMA) (E), and IgG (F), but not for IgG4 (G), anaplastic lymphoma kinase (ALK) (H), or Epstein-Barr virus (EBV) encoded RNA (EBER) (I). HE: Hematoxylin and eosin.
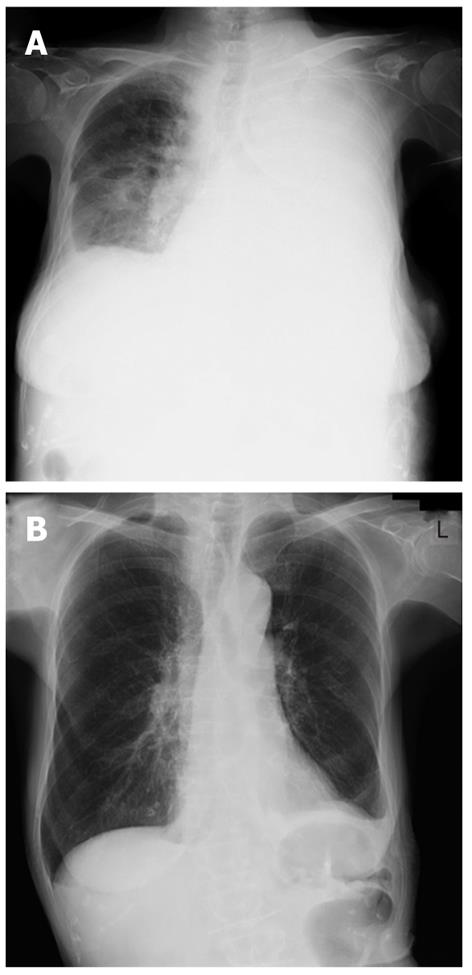
Figure 4 Chest X-ray showing massive pleural effusion of the left side before treatment (A), and full correction following steroid pulse therapy (B).
Figure 5 Follow-up computed tomography showing nearly complete resolution of the hepatic and splenic lesions other than the remaining soft density layer around the spleen (arrow).
- Citation: Kawaguchi T, Mochizuki K, Kizu T, Miyazaki M, Yakushijin T, Tsutsui S, Morii E, Takehara T. Inflammatory pseudotumor of the liver and spleen diagnosed by percutaneous needle biopsy. World J Gastroenterol 2012; 18(1): 90-95
- URL: https://www.wjgnet.com/1007-9327/full/v18/i1/90.htm
- DOI: https://dx.doi.org/10.3748/wjg.v18.i1.90


