Copyright
©2012 Baishideng Publishing Group Co.
World J Gastroenterol. Jan 7, 2012; 18(1): 90-95
Published online Jan 7, 2012. doi: 10.3748/wjg.v18.i1.90
Published online Jan 7, 2012. doi: 10.3748/wjg.v18.i1.90
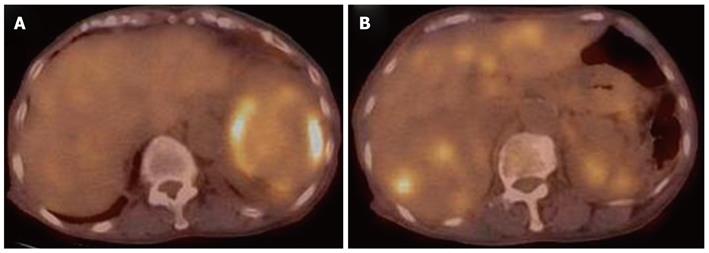
Figure 2 Fluorodeoxyglucose positron emission tomography/computed tomography analysis showing abnormal metabolic activity with a high standardized uptake value of 7.
1 surrounding the spleen (A), and multiple abnormal uptakes in segment six of the liver (B).
- Citation: Kawaguchi T, Mochizuki K, Kizu T, Miyazaki M, Yakushijin T, Tsutsui S, Morii E, Takehara T. Inflammatory pseudotumor of the liver and spleen diagnosed by percutaneous needle biopsy. World J Gastroenterol 2012; 18(1): 90-95
- URL: https://www.wjgnet.com/1007-9327/full/v18/i1/90.htm
- DOI: https://dx.doi.org/10.3748/wjg.v18.i1.90


