Copyright
©2011 Baishideng Publishing Group Co.
World J Gastroenterol. Mar 7, 2011; 17(9): 1227-1233
Published online Mar 7, 2011. doi: 10.3748/wjg.v17.i9.1227
Published online Mar 7, 2011. doi: 10.3748/wjg.v17.i9.1227
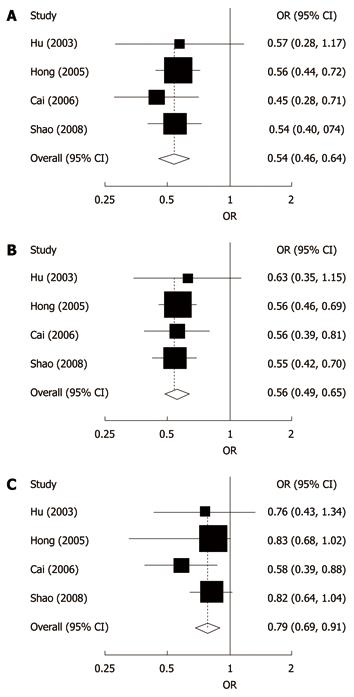
Figure 1 Forest plots for the relationship between TP53 Arg72Pro polymorphism and esophageal cancer risk in studies with population-based controls with at least 200 participants, using white blood cells or normal tissues to determine TP53 genotypes.
A: Homozygote comparison; B: Dominant model; C: Recessive model. The first authors’ surname and year of publication are given in the left part of the figure. The size of the black square corresponding to each study is proportional to the sample size. The centre of each square represents the odds ratio (OR) and the horizontal line shows the corresponding 95% CI. The pooled OR was obtained using fixed-effects model and is represented by hollow diamond, where its centre indicates the OR and its ends correspond to the 95% CI. Arg: Arginine; Pro: Proline.
- Citation: Jiang DK, Yao L, Wang WZ, Peng B, Ren WH, Yang XM, Yu L. TP53 Arg72Pro polymorphism is associated with esophageal cancer risk: A meta-analysis. World J Gastroenterol 2011; 17(9): 1227-1233
- URL: https://www.wjgnet.com/1007-9327/full/v17/i9/1227.htm
- DOI: https://dx.doi.org/10.3748/wjg.v17.i9.1227


