Copyright
©2011 Baishideng Publishing Group Co.
World J Gastroenterol. Mar 7, 2011; 17(9): 1152-1159
Published online Mar 7, 2011. doi: 10.3748/wjg.v17.i9.1152
Published online Mar 7, 2011. doi: 10.3748/wjg.v17.i9.1152
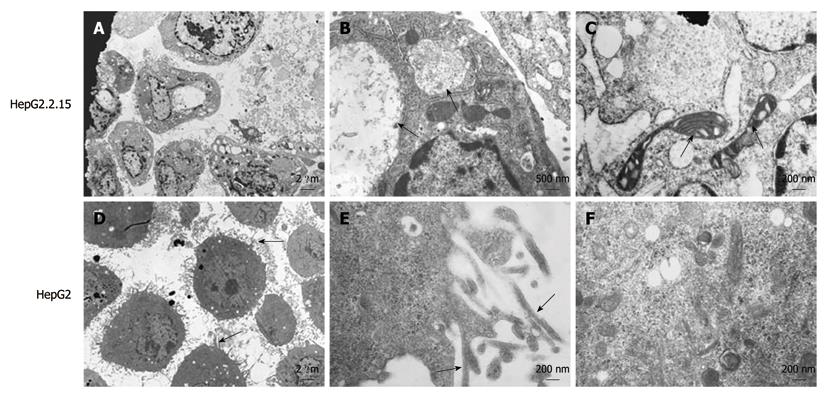
Figure 1 Ultrastructure of HepG2.
2.15 and HepG2 cells. A: Filopodia disappearance in HepG2.2.15 cells (EM × 2500); B: Viral inclusion bodies in the cytoplasm of HepG2.2.15 cells. Arrows indicate the viral inclusion bodies (EM × 15 000); C: Arrows indicate degenerated mitochondria (EM × 25 000); D: Plentiful filopodia around HepG2 cells. Arrows indicate filopodia (EM × 2500); E: Microfilament appearance in filopodia in HepG2 cells in high power field. Arrows indicate microfilament (EM × 25 000); F: Abundant organelles in the cytoplasm of HepG2 cells (EM × 25 000).
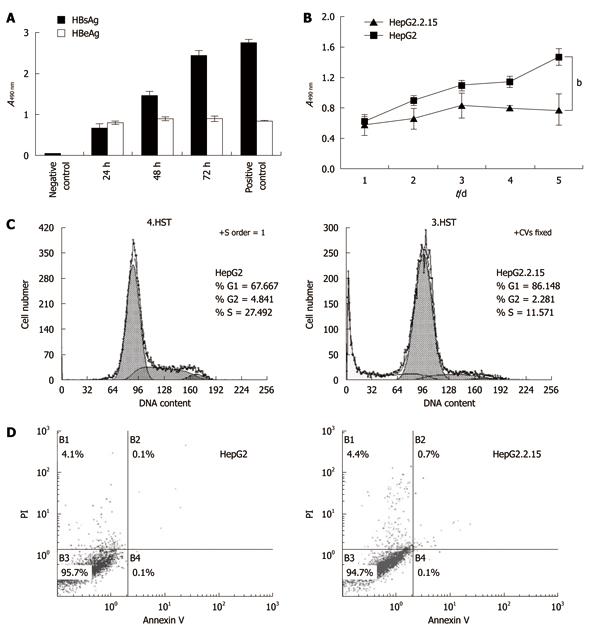
Figure 2 Cell proliferation and apoptosis flow cytometry.
A: The levels of hepatitis B surface antigen (HBsAg) and hepatitis B envelope antigen (HBeAg) in HepG2.2.15 cell supernatant. The supernatant was collected every 24 h and tested by enzyme-linked immunosorbent assay; B: 3-(4,5-Dimethylthiazol-2-yl)-2,5-diphenyltetrazolium bromide assay of cell proliferation. The absorbencies of test wells were read every 24 h and the data represent the mean ± SD (bP < 0.001); C: Flow cytometry of cell cycle; D: Apoptosis percentages in B1, B2 and B4 areas. All experiments were repeated three times with similar results.
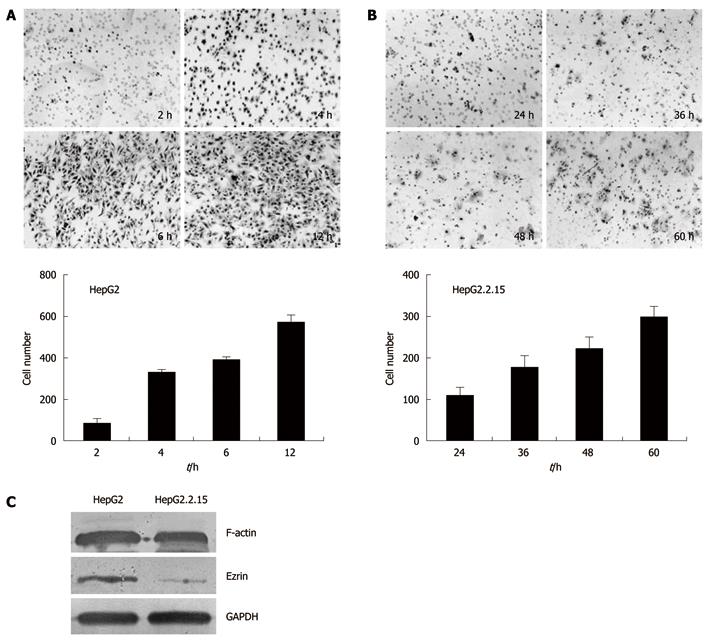
Figure 3 Invasion assays of HepG2 and HepG2.
2.15 cells. The trans-well membranes were collected at different time points and the cells that went through the pores were stained with hematoxylin and eosin. The cell numbers were counted. A: HepG2 cells collected and stained at 2 h, 4 h, 6 h and 12 h after incubation; B: HepG2.2.15 cells collected and stained at 24 h, 36 h, 48 h and 60 h after incubation; C: Western blotting analysis of F-actin and Ezrin.
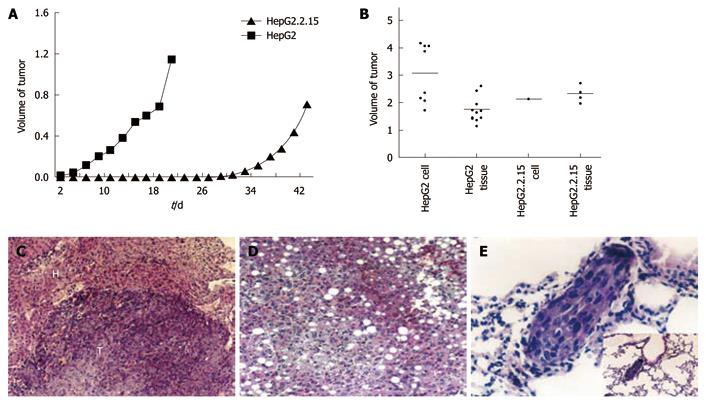
Figure 4 Tumor formation of HepG2 and HepG2.
2.15 cells in vivo. A: The volume of subcutaneous tumors were measured and recorded every 2 d. The difference of tumor growth rate between HepG2 and HepG2.2.15 groups was significant (P < 0.01, Mann-Whithey U test); B: Tumor development in four groups in vivo; C: Expansive growth of tumor. The boundary of tumor and normal tissue is clear [hematoxylin and eosin (HE) stain, × 120]. T: Tumor; H: Liver tissue; D: Fatty changes in liver tissue of HepG2.2.15 groups (HE stain, × 120); E: Lung metastasis in HepG2 injected group (HE stain, × 460) and low power field.
- Citation: Zhao R, Wang TZ, Kong D, Zhang L, Meng HX, Jiang Y, Wu YQ, Yu ZX, Jin XM. Hepatoma cell line HepG2.2.15 demonstrates distinct biological features compared with parental HepG2. World J Gastroenterol 2011; 17(9): 1152-1159
- URL: https://www.wjgnet.com/1007-9327/full/v17/i9/1152.htm
- DOI: https://dx.doi.org/10.3748/wjg.v17.i9.1152


