Copyright
©2011 Baishideng Publishing Group Co.
World J Gastroenterol. Mar 7, 2011; 17(9): 1143-1151
Published online Mar 7, 2011. doi: 10.3748/wjg.v17.i9.1143
Published online Mar 7, 2011. doi: 10.3748/wjg.v17.i9.1143
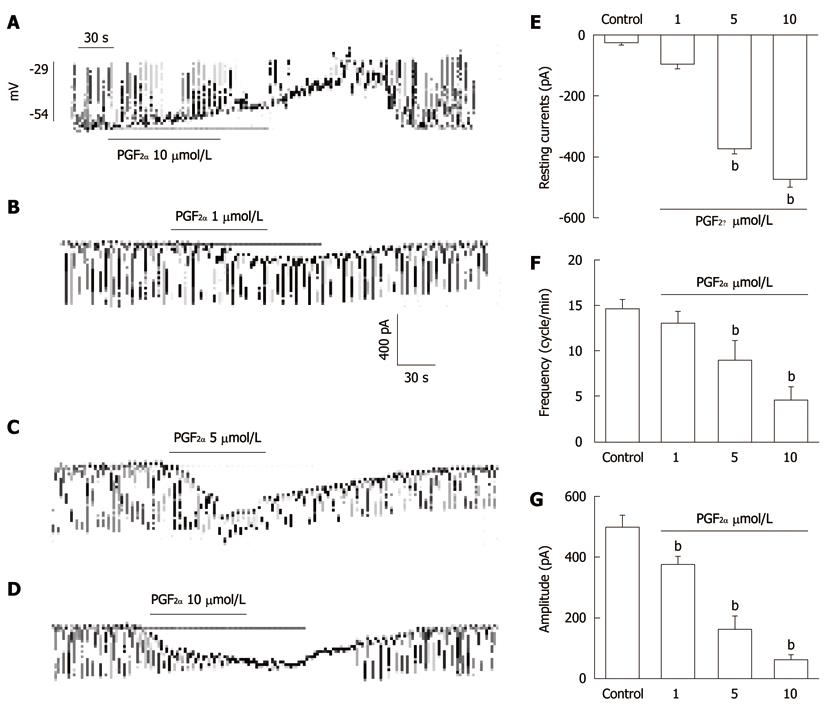
Figure 1 The effects of Prostaglandin F2α on pacemaker potentials and pacemaker currents recorded in cultured interstitial cells of Cajal from mouse small intestine.
A: Pacemaker potentials of interstitial cells of Cajal (ICC) exposed to Prostaglandin F2α (PGF2α) (10 μmol/L) in the current-clamping mode (I = 0). Vertical solid line scales denote amplitude of pacemaker potential and horizontal solid line scales denote duration of recording (s) pacemaker potentials; B-D: Pacemaker currents of ICC recorded at a holding potential of -70 mV exposed to various concentrations of PGF2α (1, 5, and 10 μmol/L). The dotted lines indicate zero current levels. Vertical solid line scales denote amplitude of pacemaker current and horizontal solid line scales denote duration of recording (s) pacemaker currents. The responses to PGF2α are summarized in E-G. The bars represent mean ± SE. bP < 0.01 vs the untreated control.
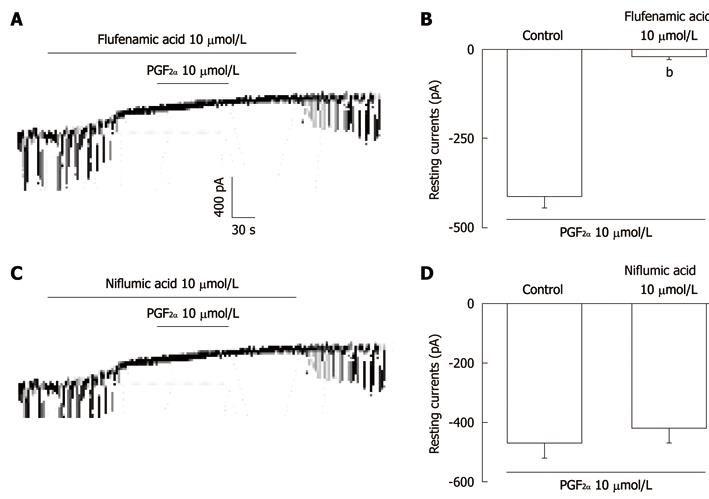
Figure 2 The effects of flufenamic acid or niflumic acid on prostaglandin F2α-induced responses in pacemaker currents in cultured interstitial cells of Cajal from mouse small intestine.
A: Application of flufenamic acid (10 μmol/L) abolished the generation of pacemaker currents. Under these conditions, the prostaglandin F2α (PGF2α) (10 μmol/L) did not produce tonic inward currents; C: Niflumic acid (10 μmol/L) also abolished the generation of pacemaker currents. However, niflumic acid did not block the PGF2α (10 μmol/L)-induced tonic inward currents. The dotted lines indicate zero current levels. Responses to the PGF2α in the presence of flufenamic acid or niflumic acid are summarized in B and D. Vertical solid line scales denote amplitude of pacemaker current and horizontal solid line scales denote duration of recording (s) pacemaker currents. The bars represent mean ± SE. bP < 0.01 vs the untreated control.
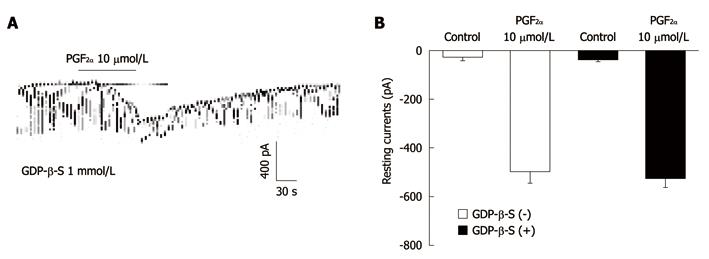
Figure 3 The effects of 5’-[-thio]diphosphate trilithium salt on response to prostaglandin F2α-induced pacemaker currents from interstitial cells of Cajal from mouse small intestine.
A: Pacemaker currents from interstitial cells of Cajal exposed to prostaglandin F2α (PGF2α) (10 μmol/L) in the presence of 5’-[-thio]diphosphate trilithium salt (GDP-β-S) (1 mmol/L) in the pipette. The tonic inward currents with suppressed amplitude and frequency induced by PGF2α remained unchanged during internally applied GDP-β-S (1 mmol/L). The dotted lines indicate the zero current levels. The effects of PGF2α in the presence of GDP-β-S are summarized in B. Vertical solid line scales denote amplitude of pacemaker current and horizontal solid line scales denote duration of recording (s) pacemaker currents. Bars represent mean ± SE. The effects of GDP-β-S on PGF2α-induced pacemaker currents were not significantly different from the PGF2α-induced pacemaker currents in the absence of GDP-β-S.
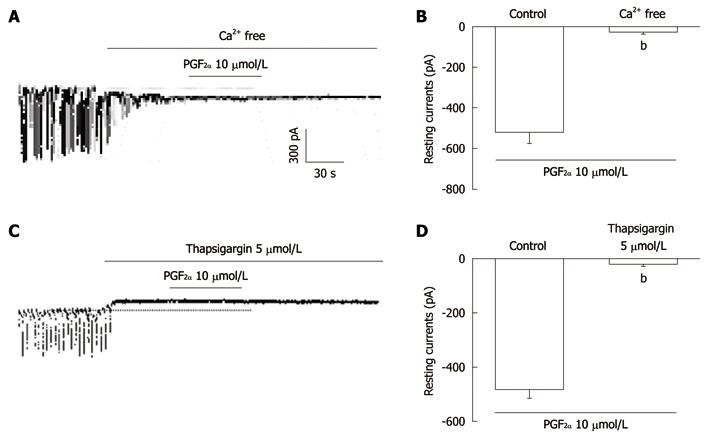
Figure 4 The effects of an external Ca2+-free solution or thapsigargin on the prostaglandin F2α-induced response in pacemaker currents in cultured interstitial cells of Cajal from mouse small intestine.
A: External Ca2+-free solution abolished the generation of pacemaker currents. Under these conditions, the prostaglandin F2α (PGF2α) (10 μmol/L)-induced tonic inward currents were blocked; C: Thapsigargin (5 μmol/L) abolished the generation of pacemaker currents. Thapsigargin also blocked the PGF2α (10 μmol/L)-induced tonic inward currents. The dotted lines indicate the zero current levels. Responses to the PGF2α in the external Ca2+-free solution and in the presence of thapsigargin are summarized in B and D. Vertical solid line scales denote amplitude of pacemaker current and horizontal solid line scales denote duration of recording (s) pacemaker current. The bars represent mean ± SE. bP < 0.01 vs the untreated control.
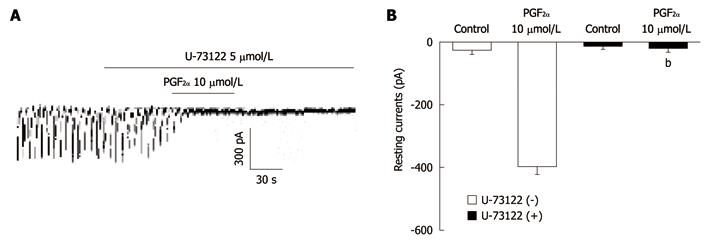
Figure 5 The effects of U-73122 on the prostaglandin F2α-induced response in pacemaker currents of cultured interstitial cells of Cajal from mouse small intestine.
A: U-73122 (5 μmol/L) abolished the generation of pacemaker currents. U-73122 also blocked the Prostaglandin F2α (PGF2α) (10 μmol/L)-induced tonic inward currents. The dotted lines indicate the zero current levels. Responses to the PGF2α are summarized in B. Vertical solid line scales denote amplitude of pacemaker current and horizontal solid line scales denote duration of recording (s) pacemaker current. The bars represent mean ± SE. The effect of U-73122 on PGF2α-induced pacemaker currents was significantly different from the PGF2α-induced pacemaker currents in the absence of U-73122 (bP < 0.01).
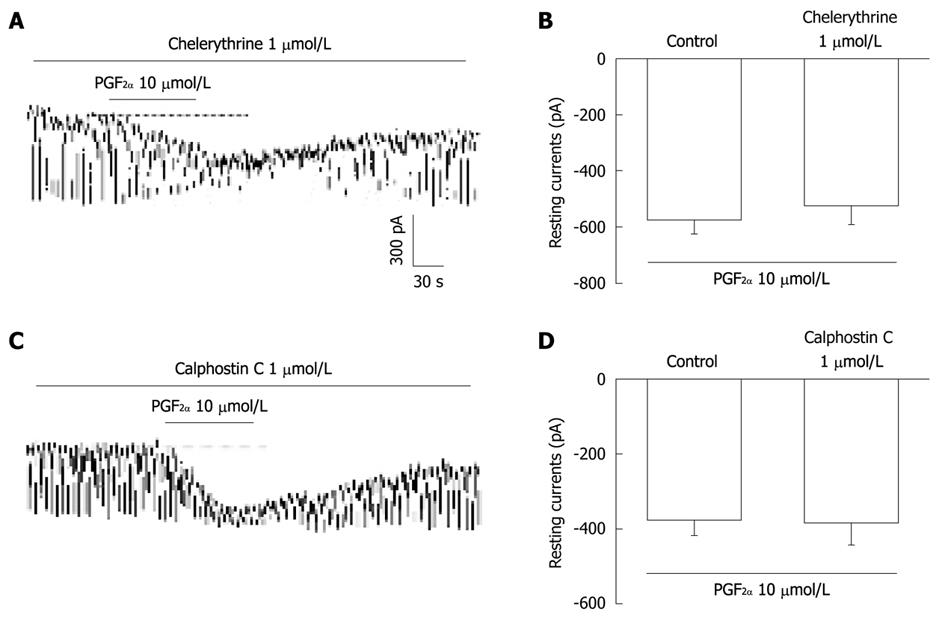
Figure 6 The effects of chelerythrine or calphostin C on the prostaglandin F2α-induced response in pacemaker currents in cultured interstitial cells of Cajal from mouse small intestine.
A and C: Pacemaker currents of interstitial cells of Cajal exposed to prostaglandin F2α (PGF2α) (10 μmol/L) in the presence of chelerythrine (1 μmol/L) or calphostin C (1 μmol/L). Under these conditions, the PGF2α caused tonic inward currents. The dotted lines indicate the zero current levels. Responses to the PGF2α in the presence of chelerythrine or calphostin C are summarized in B and D. Vertical solid line scales denote amplitude of pacemaker current and horizontal solid line scales denote duration of recording (s) pacemaker current. The bars represent mean ± SE. No significant difference from the untreated control.
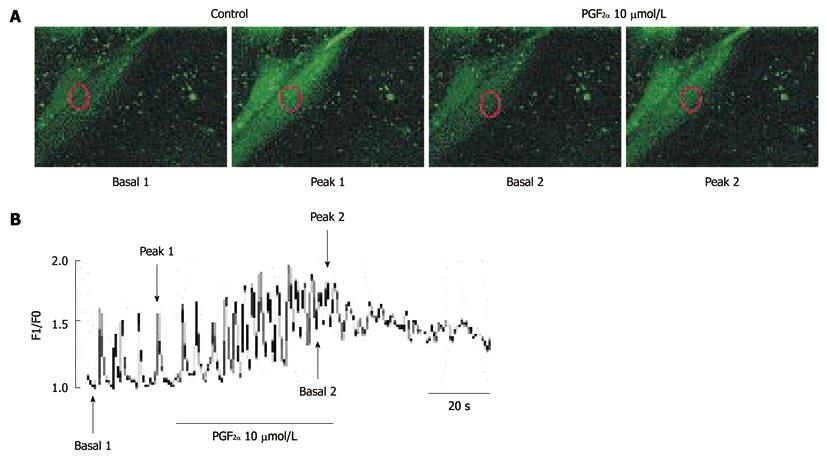
Figure 7 Effects of Prostaglandin F2α on intracellular Ca2+ oscillations in cultured interstitial cells of Cajal from mouse small intestine.
A: Sequential fluorescence intensity images of fluo-3-loaded cultured interstitial cells of Cajal under normal conditions. The representative frames indicate in (B) basal 1, 2, peak 1 and 2. The exposure time of each frame was 500 ms; B: Fluorescence intensity change plotted in (A) red marker in absence and presence of Prostaglandin F2α (PGF2α) (10 μmol/L). The horizontal solid line scales denote duration of fluorescence intensity change (s).
- Citation: Park CG, Kim YD, Kim MY, Koh JW, Jun JY, Yeum CH, So I, Choi S. Effects of prostaglandin F2α on small intestinal interstitial cells of Cajal. World J Gastroenterol 2011; 17(9): 1143-1151
- URL: https://www.wjgnet.com/1007-9327/full/v17/i9/1143.htm
- DOI: https://dx.doi.org/10.3748/wjg.v17.i9.1143


