Copyright
©2011 Baishideng Publishing Group Co.
World J Gastroenterol. Feb 21, 2011; 17(7): 932-937
Published online Feb 21, 2011. doi: 10.3748/wjg.v17.i7.932
Published online Feb 21, 2011. doi: 10.3748/wjg.v17.i7.932
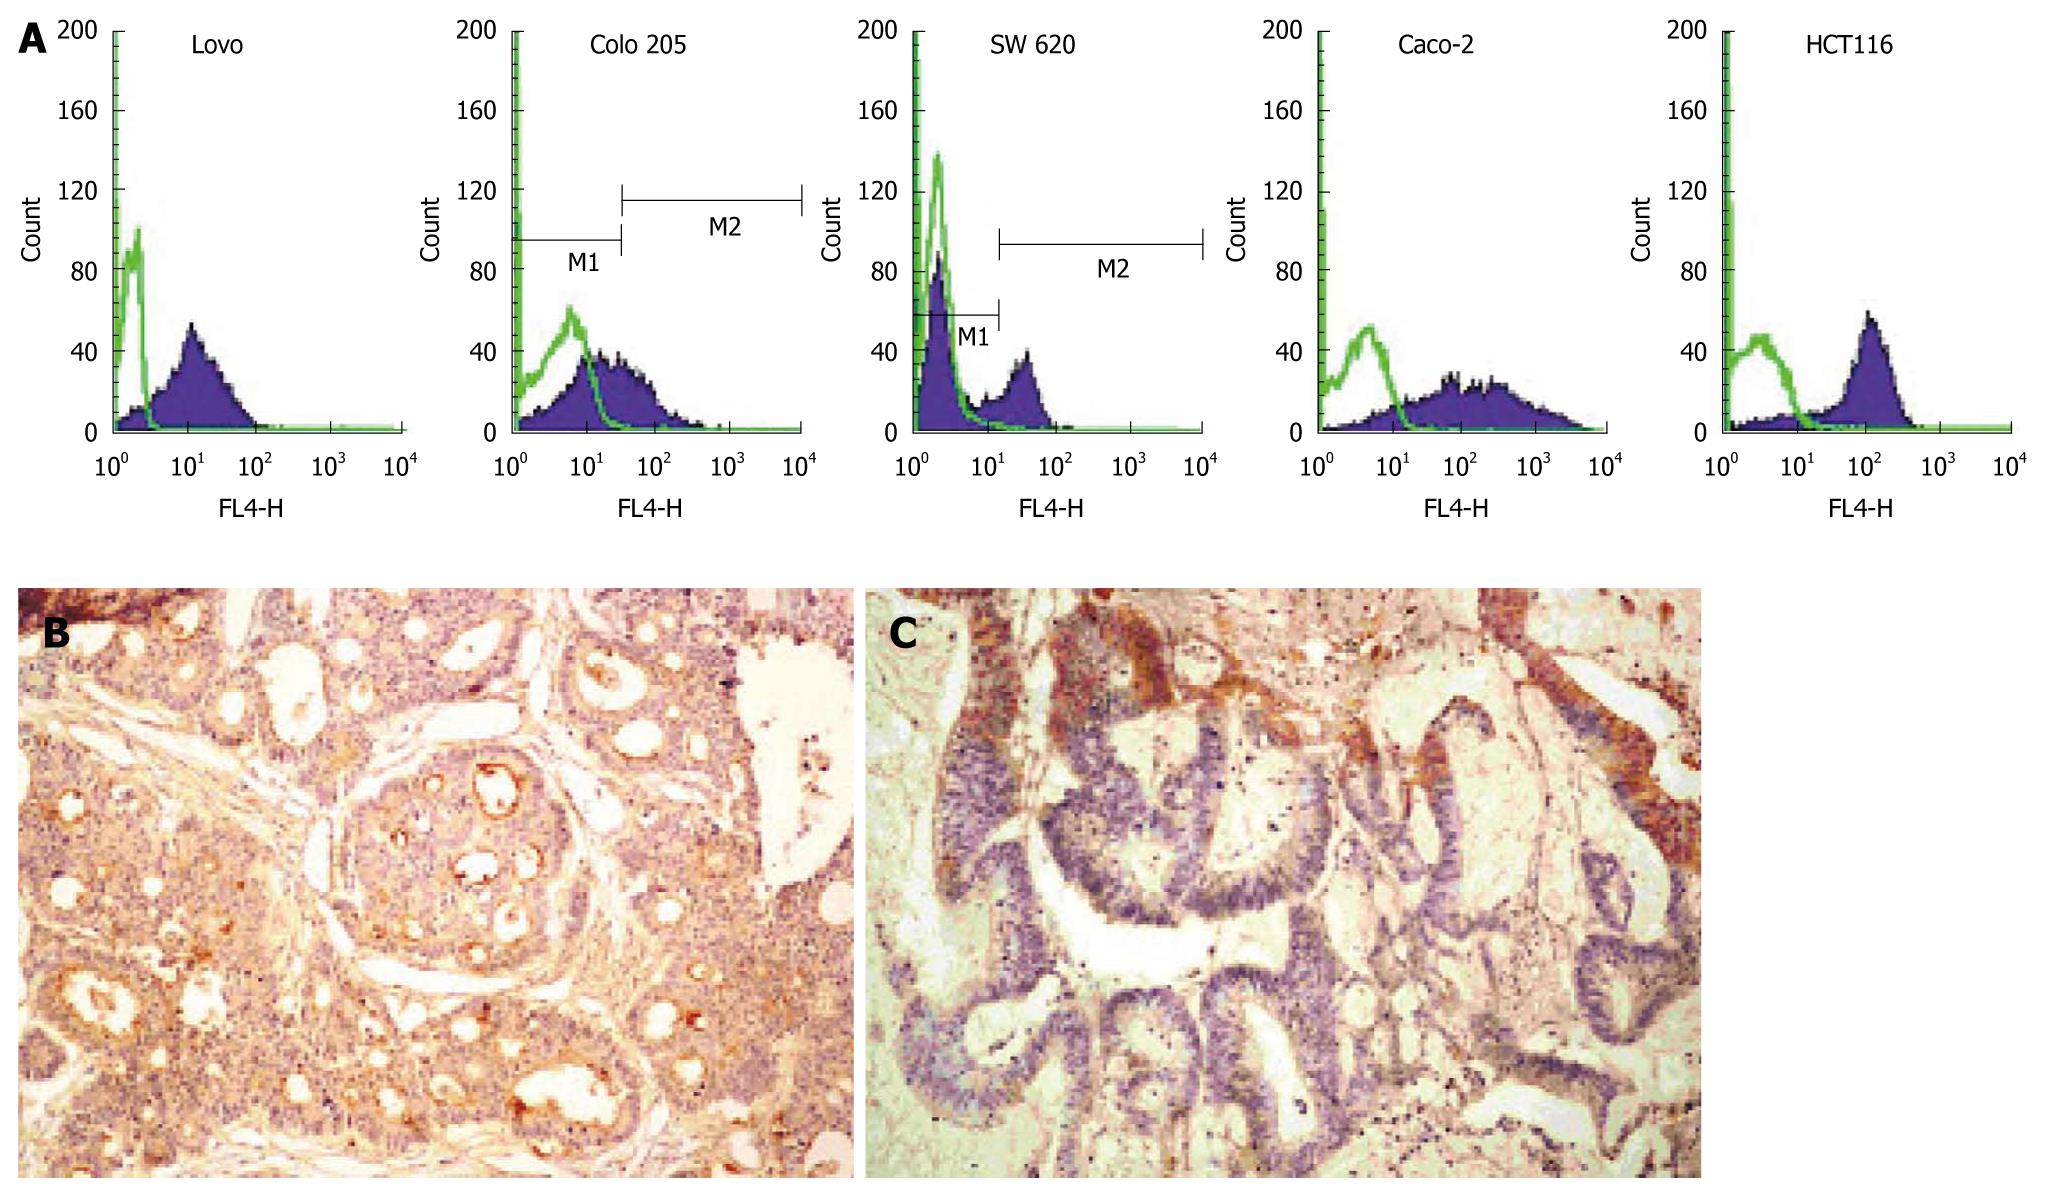
Figure 1 Fluorescence-activated cell sorting showing CD133 expression in different colorectal cancer cell lines (A), CD133 staining of human primary colorectal cancer tissue (B) and metastatic colorectal cancer tissue (C) (Original magnification × 100).
Brown indicates positive staining.
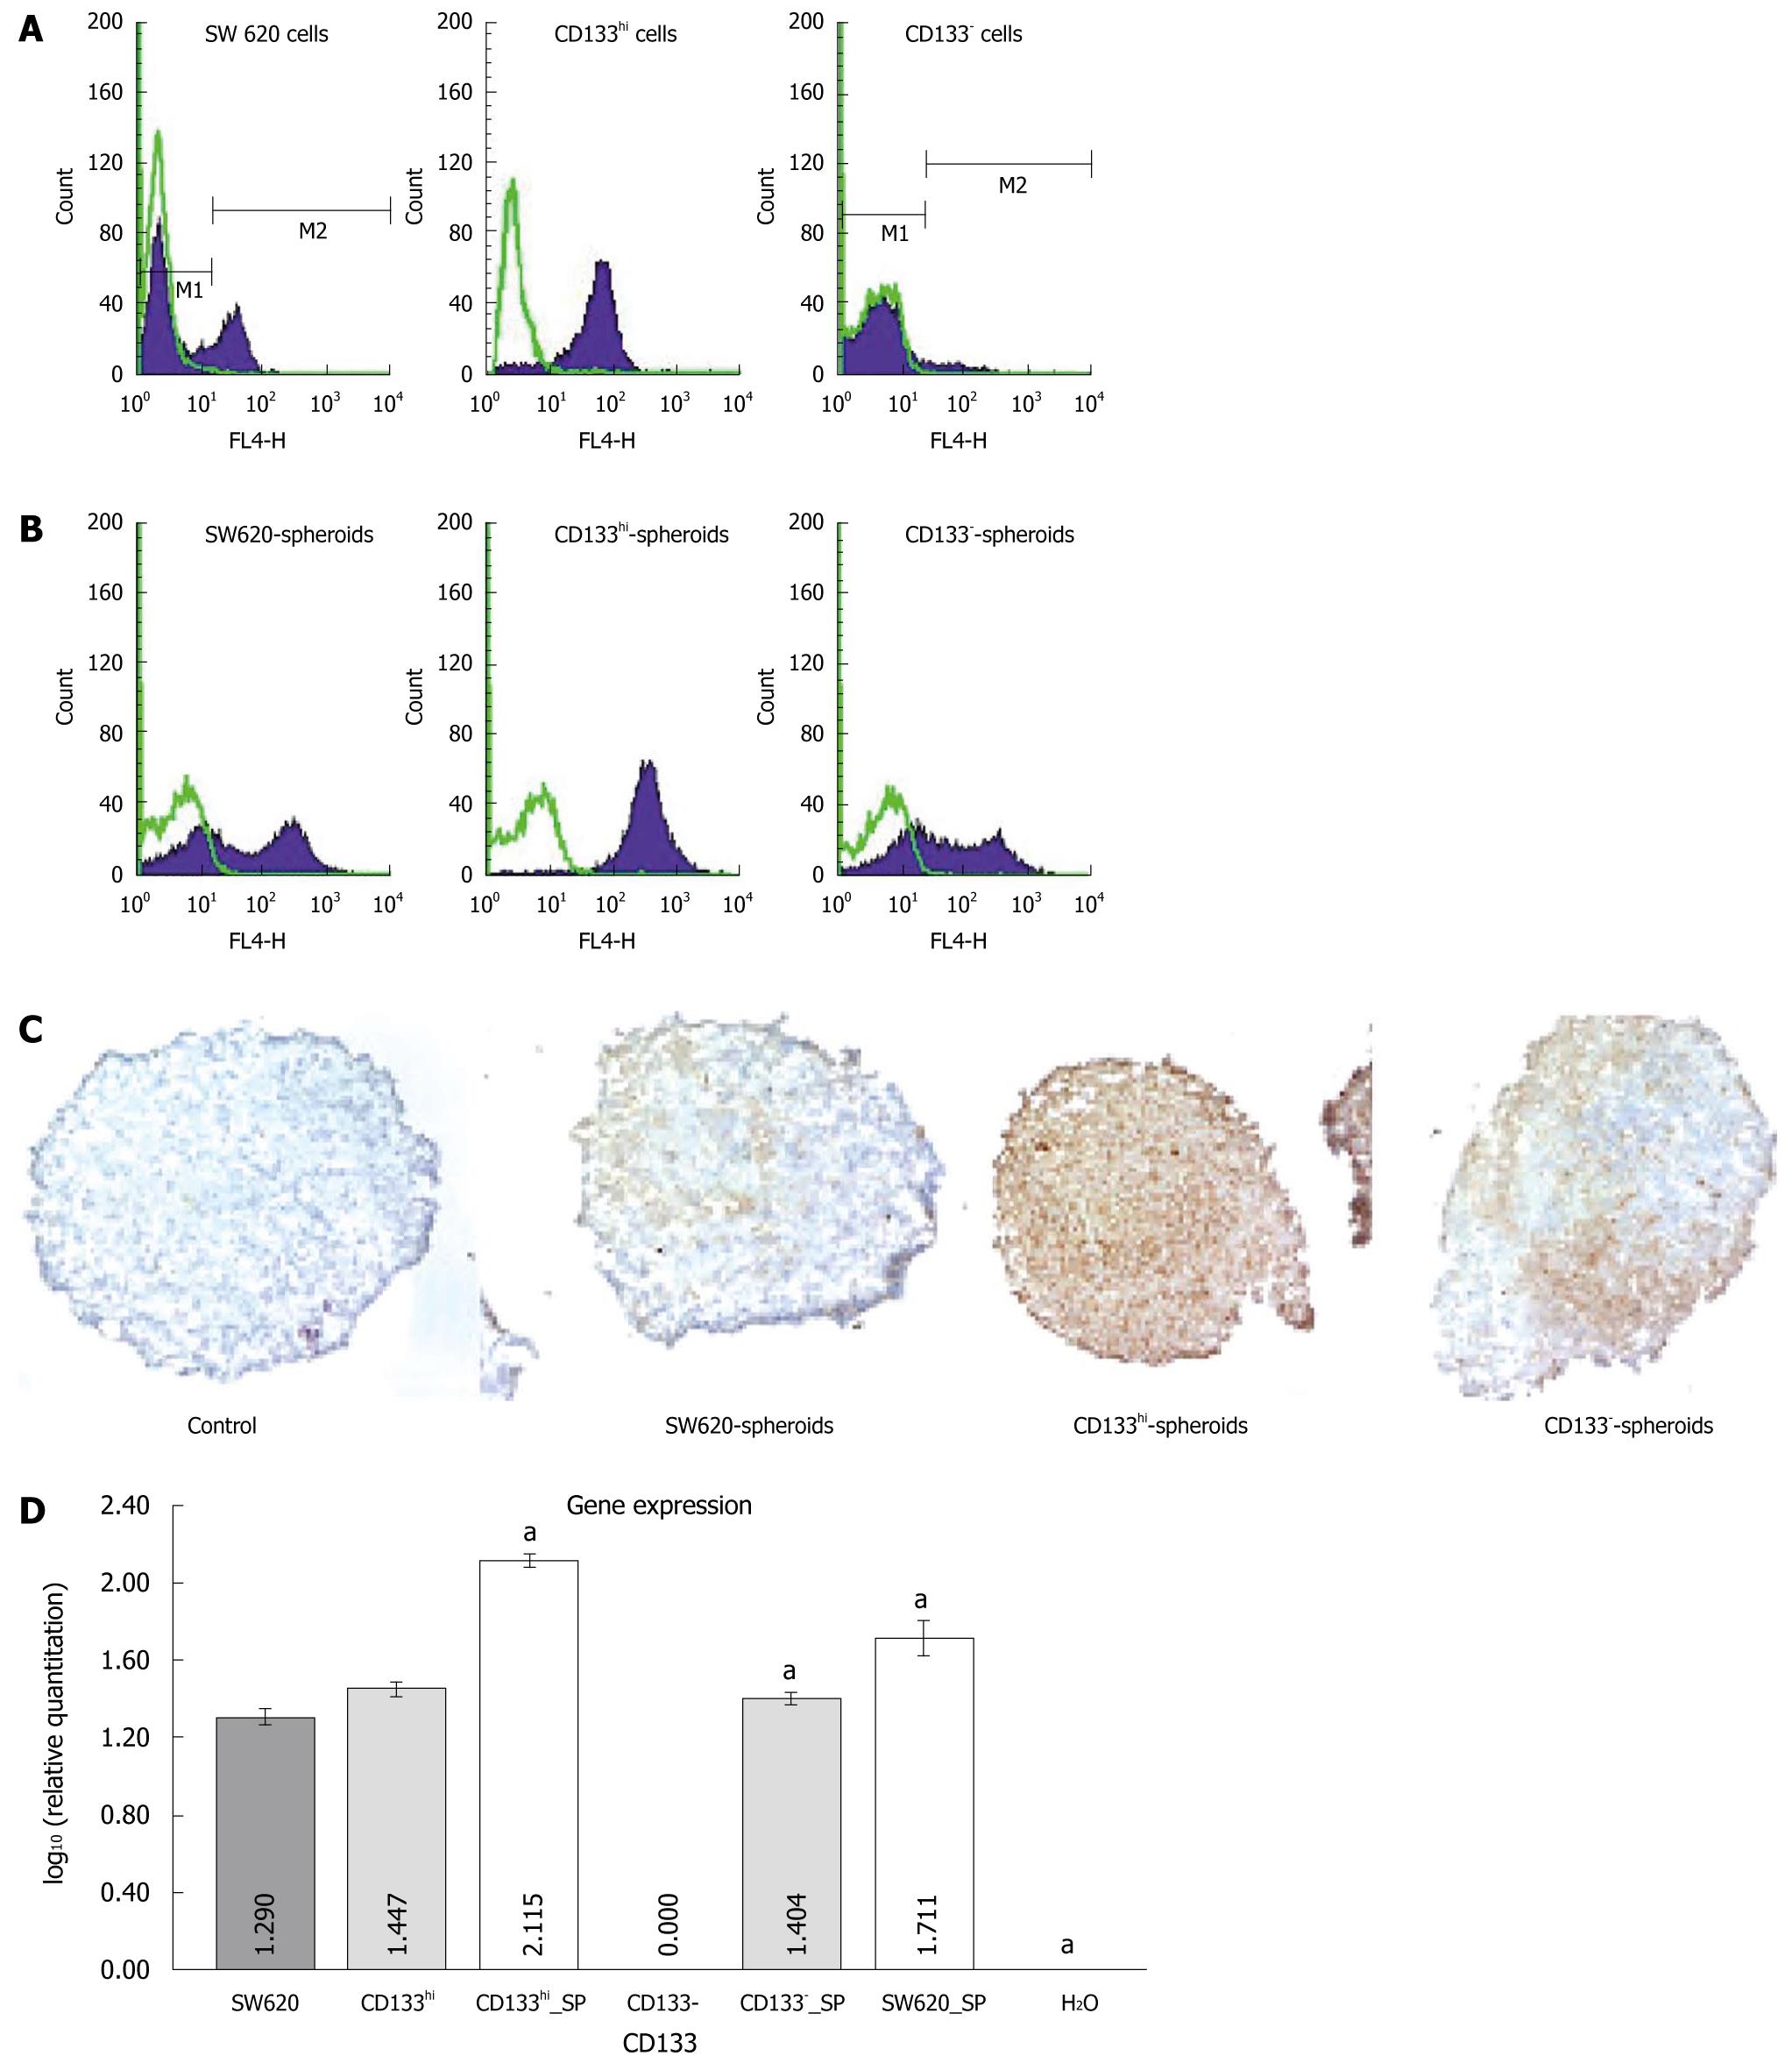
Figure 2 Fluorescence-activated cell sorting showing CD133 expression in SW620, CD133- and CD133hi cells (A) and in their spheroids (B), CD133 staining in spheroids of SW620, CD133- and CD133hi cells (original magnification × 100, brown indicates positive staining) (C), and reverse transcription-polymerase chain reaction showing CD133 expression in SW620, CD133- and CD133hi cells and their spheroids.
aP < 0.05 vs monolayer cells. SP: Spheroid.
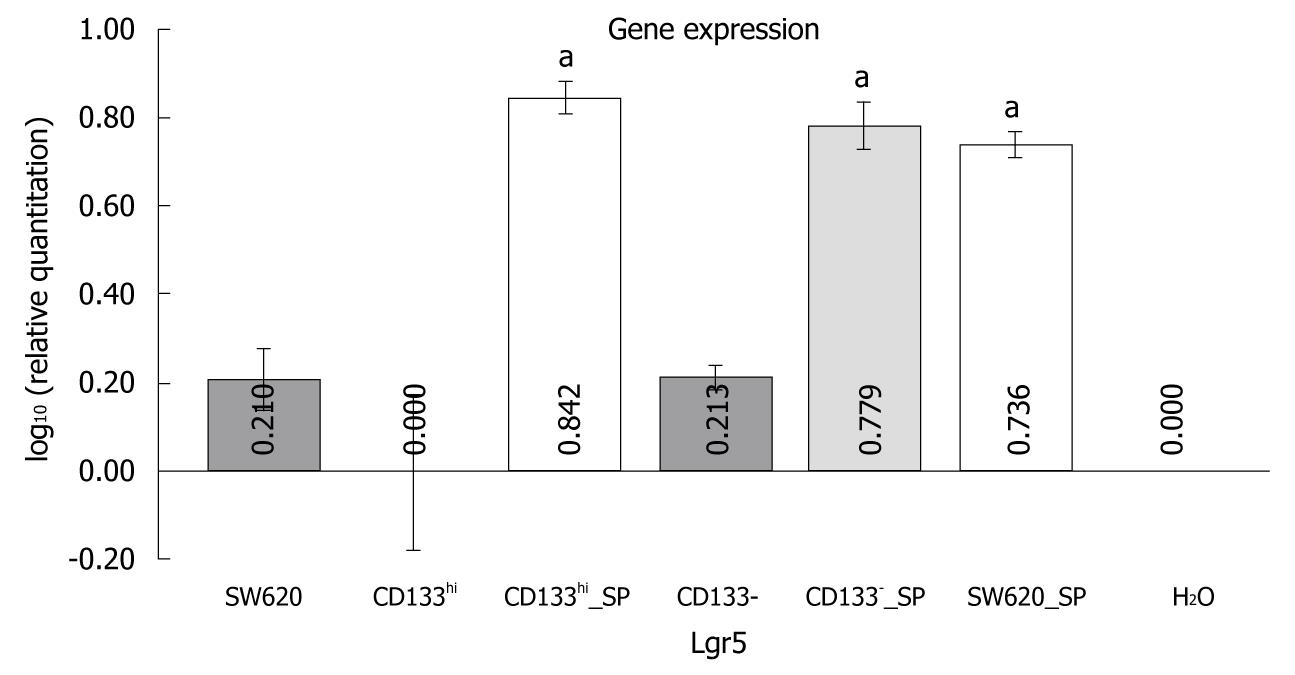
Figure 3 Quantitative reverse transcription-polymerase chain reaction showing Lgr5 expression in SW620, CD133- and CD133hi cells and their spheroids.
aP < 0.05 vs monolayer cells. SP: Spheroid.
- Citation: Yang ZL, Zheng Q, Yan J, Pan Y, Wang ZG. Upregulated CD133 expression in tumorigenesis of colon cancer cells. World J Gastroenterol 2011; 17(7): 932-937
- URL: https://www.wjgnet.com/1007-9327/full/v17/i7/932.htm
- DOI: https://dx.doi.org/10.3748/wjg.v17.i7.932


