Copyright
©2011 Baishideng Publishing Group Co.
World J Gastroenterol. Dec 28, 2011; 17(48): 5305-5309
Published online Dec 28, 2011. doi: 10.3748/wjg.v17.i48.5305
Published online Dec 28, 2011. doi: 10.3748/wjg.v17.i48.5305
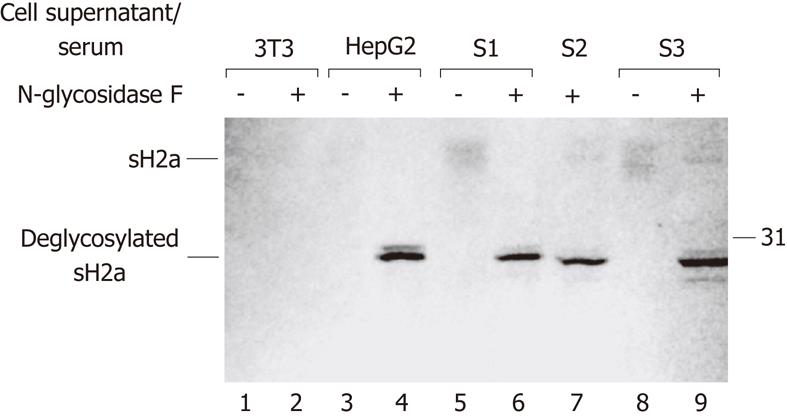
Figure 1 sH2a is detected in normal human sera.
Cell supernatants from 90 mm petri-dishes of NIH 3T3 (lanes 1-2) or HepG2 cells (lanes 3-4) or 0.3 mL of normal human sera from 3 donors (S1, lanes 5 and 6; S2, lane 7; S3, lanes 8 and 9) were immunoprecipitated with polyclonal anti-H2a carboxyterminal antibodies that were crosslinked to protein A-agarose, and the immunoprecipitates were subjected to 12% sodium dodecyl sulfate polyacrylamide gel electrophoresis. Immunoblotting was then done with anti-H2a carboxyterminal antibody followed by horseradish peroxidase-conjugated goat anti-rabbit IgG and color development with 3,3’,5,5’-tetramethylbenzidine. Samples on lanes 2, 4, 6, 7 and 9 were treated with N-glycosidase-F after immunoprecipitation. On the right is the molecular weight of a protein standard in kilodaltons. On the left are the migrations of sH2a before or after deglycosylation.
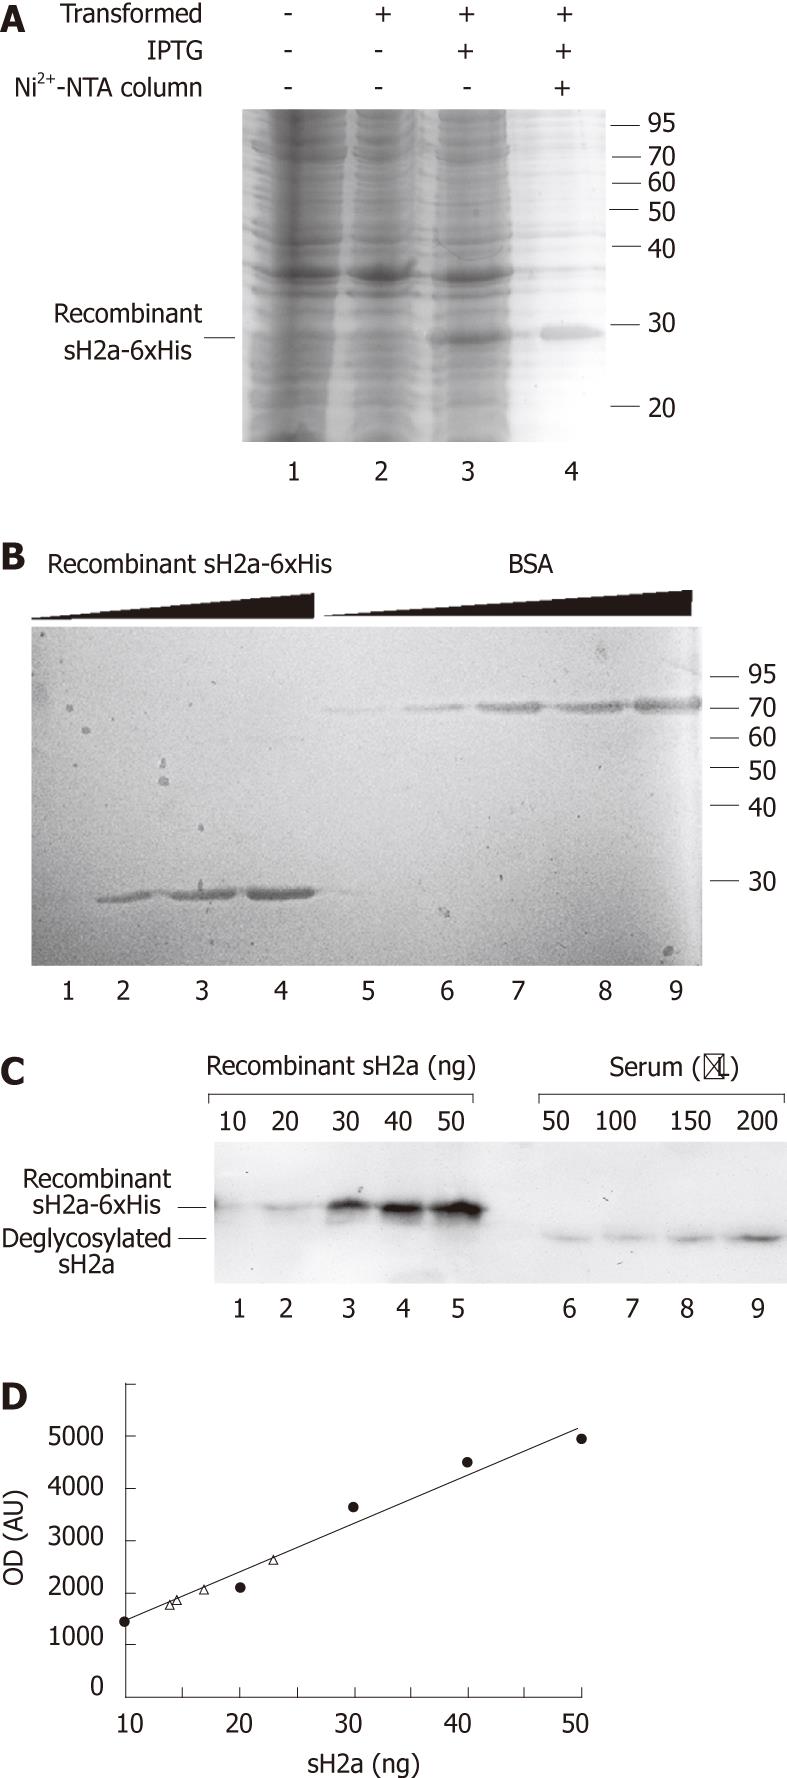
Figure 2 Recombinant sH2a concentration in serum.
A: Escherichia coli Rosetta DE3 pLysS were either left untransformed or transformed by heat shock with a plasmid carrying 6xHis-tagged sH2a and induced with 0.3 mmol isopropyl β-D-1-thiogalactopyranosid as explained in Materials and Methods. Cell lysates were treated with 6 mol guanidinium-hydrochloride, dyalized and run on 12% sodium dodecyl sulfate polyacrylamide gel electrophoresis (SDS-PAGE), comparing with an aliquot of tagged sH2a purified on a Ni2+-NTA-agarose column (lane 4). The gel was stained with imperial blue; B: Increasing amounts of recombinant affinity purified 6xHis-tagged sH2a (lanes 1-4 correspond to 127, 635, 1270 and 1905 ng) were compared with increasing amounts of bovine serum albumin (lanes 5-9 are 100, 200, 500, 1000 and 2000 ng) on 12% SDS-PAGE, stained with Imperial blue; C and D: The indicated increasing concentrations of recombinant 6xHis-tagged sH2a were run on SDS-PAGE after immunoprecipitation with B9 antibody (lanes 1-5) and compared with B9-immunoprecipitates from increasing volumes of normal human serum treated with N-glycosidase-F (lanes 6-9) and analyzed by immunoblot as in Figure 1, except that detection was done using the electrochemiluminescence procedure. The immunoblot was quantified and the graph (D) shows a curve of recombinant sH2a (full circles) and extrapolation of the concentration of sH2a in 50, 100, 150 and 200 μL of serum (triangles). Shown is an immunoblot representative of three repeat experiments.
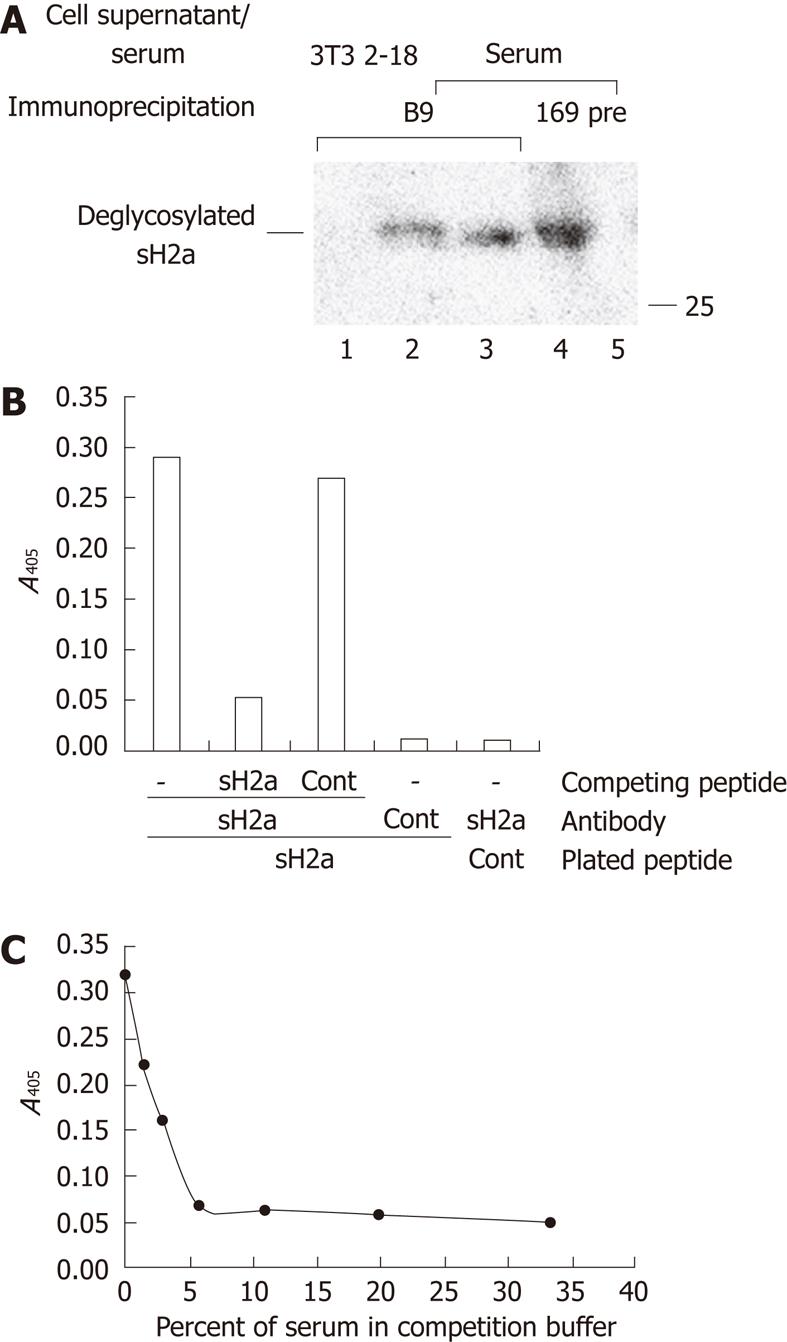
Figure 3 Monoclonal antibody and enzyme-linked immunosorbent assay for detection of sH2a in human sera.
A: Medium from two 90 mm dishes of control NIH 3T3 cells (lane 1) or of the same cells stably expressing sH2a (2-18 cell line, lane 2) or 0.5 mL of normal human serum (lanes 3-5) were immunoprecipitated with B9 monoclonal antibody (lanes 1-3), or with a mixture of polyclonal anti-H2a 169 and anti-carboxyterminal antibodies (lane 4) or with control preimmune rabbit serum (lane 5). All immunoprecipitates were treated with N-glycosidase-F and analyzed as in Figure 2C. Shown is an immunoblot representative of three repeat experiments; B: Competitive enzyme-linked immunosorbent assay (ELISA) was performed as described in Materials and Methods, binding the anti-sH2a monoclonal B9 antibody (sH2a) or a control antibody (cont) to the specific sH2a or control (cont) peptides plated on a 96 well plate, after competition with the same sH2a or control peptides (0.5 μg/mL). Values are averages of quadruplicates; C: A similar ELISA assay was done with the B9 antibody and plating the sH2a peptide, but competing the antibody with different dilutions of human serum from a healthy individual (indicated as percent serum of the total volume).
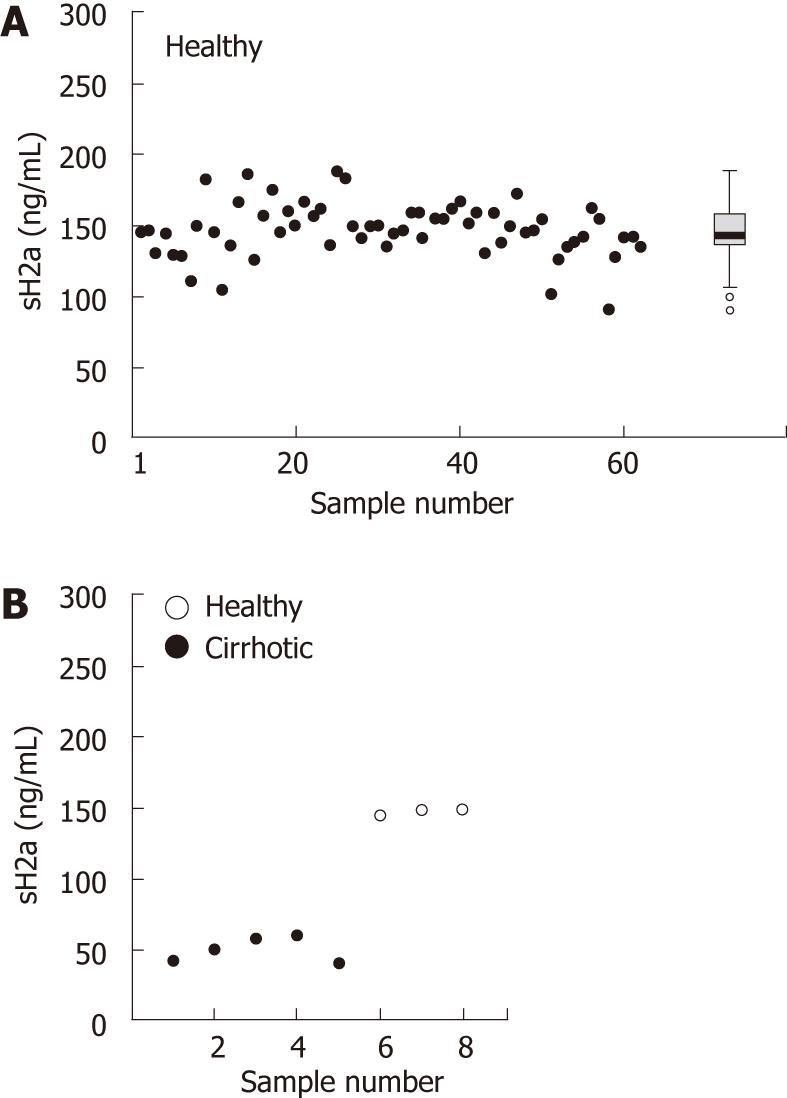
Figure 4 Levels of sH2a in healthy individuals and in hepatitis C virus patients with cirrhosis.
A: The enzyme-linked immunosorbent assay (ELISA) described in Figure 3 was used to measure the concentration of sH2a in 62 healthy individuals, male and female, with a wide range of ages. The box height indicates the interquartile range (IQR). The thick horizontal bar is the median. The whiskers extend to the farthest non-outlier value smaller than 1.5 x IQR. Empty circles indicate “mild" outliers (< 3 x IQR); B: The concentration of sH2a in sera was measured blindly by ELISA, from 5 hepatitis C virus patients with cirrhosis compared to 3 healthy individuals.
- Citation: Benyair R, Kondratyev M, Veselkin E, Tolchinsky S, Shenkman M, Lurie Y, Lederkremer GZ. Constant serum levels of secreted asialoglycoprotein receptor sH2a and decrease with cirrhosis. World J Gastroenterol 2011; 17(48): 5305-5309
- URL: https://www.wjgnet.com/1007-9327/full/v17/i48/5305.htm
- DOI: https://dx.doi.org/10.3748/wjg.v17.i48.5305


