Copyright
©2011 Baishideng Publishing Group Co.
World J Gastroenterol. Oct 28, 2011; 17(40): 4470-4478
Published online Oct 28, 2011. doi: 10.3748/wjg.v17.i40.4470
Published online Oct 28, 2011. doi: 10.3748/wjg.v17.i40.4470
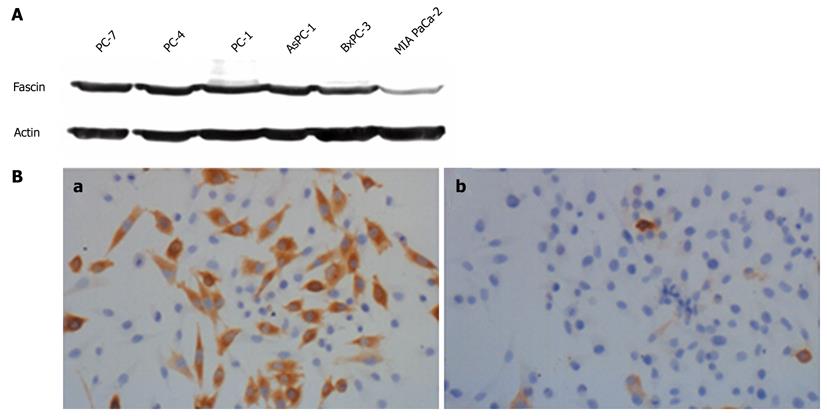
Figure 1 The selection and generation of fascin-overexpressing pancreatic cancer cells.
A: Western blotting analysis of fascin expression in pancreatic cancer cell lines. Fascin protein was present in all pancreatic cancer cell lines at different expression levels. BxPC-3, AsPC-1, PC-1, PC-4 and PC-7 express fascin at a high level, whereas MIA PaCa-2 expresses fascin at a very low level. Actin served as a loading control; B: Immunohistochemical analysis of fascin expression in MIA PaCa-2 cells transfected with either pcDNA3-Fascin or pcDNA3-Vector. (a) MIA PaCa-2 Fascin represents the stable transfected fascin-expressing cell line; (b) MIA PaCa-2 Vector is the control cell line. Magnification is × 200.
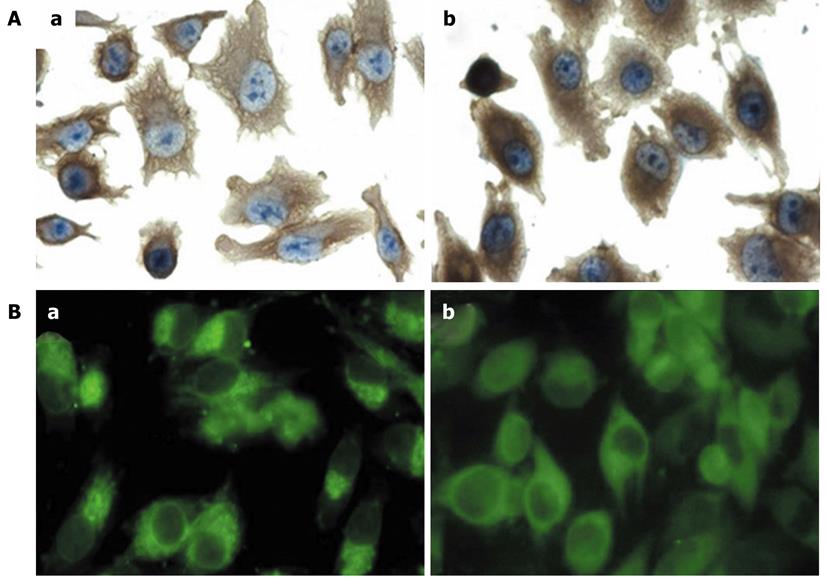
Figure 2 Fascin overexpression induces alteration of cell morphology and cytoskeleton.
A: Immunohistochemical analysis of actin distribution in fascin-overexpressing cells and vector control cells (× 400). (a) MIA PaCa-2 Fascin cells were more polarized with elongated membrane projections. Actin filaments were distributed as bundles in the cytoplasm which protruded into membrane projections in MIA PaCa-2 Fascin cells. (b) MIA PaCa-2 Vector cells showed a diffuse actin distribution; B: Immunofluorescence analysis of actin distribution in fascin-overexpressing cells and vector control cells (× 400). (a) Actin accumulated in a polarized manner in MIA PaCa-2 Fascin cells, whereas (b) MIA PaCa-2 Vector cells demonstrated a diffuse actin distribution.
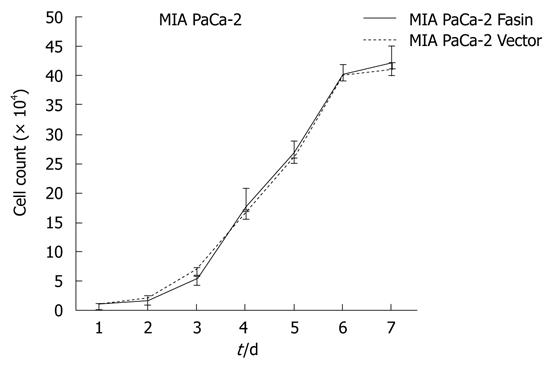
Figure 3 The growth curves of MIA PaCa-2 Fascin and MIA PaCa-2 Vector cells.
There were no significant differences between the two groups.
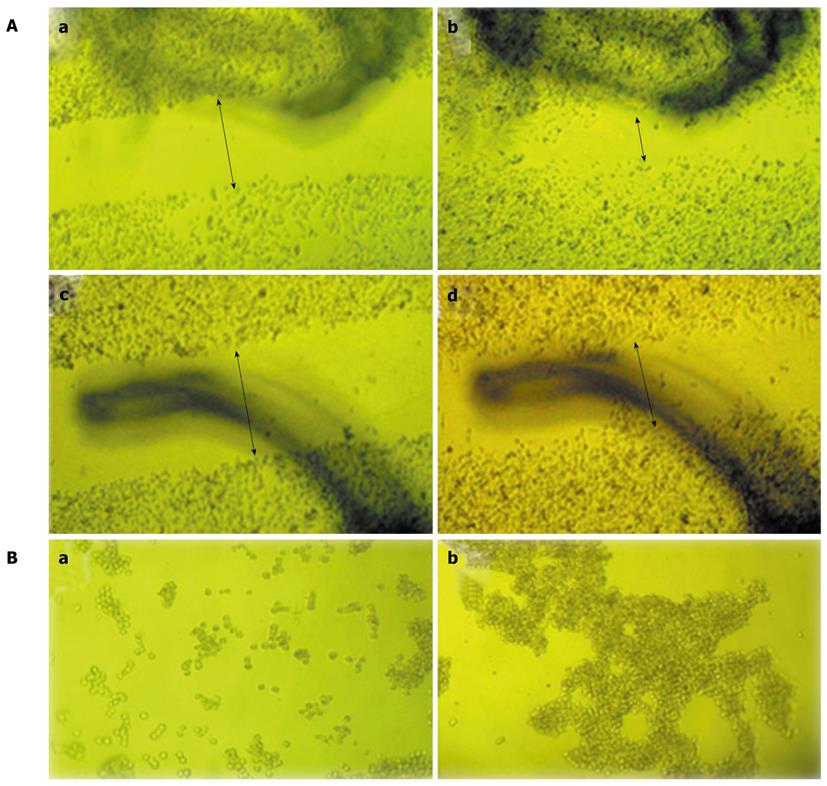
Figure 4 Fascin promotes cell migration and inhibits cell aggregation.
A: The effect of fascin overexpression on the cell migration of MIA PaCa-2 cells. Images were taken at 0 h (a, c) and 20 h (b, d) (× 60). MIA PaCa-2 Fascin cells (a, b) repopulated the open space more efficiently than did MIA PaCa-2 Vector cells (c, d). The arrows in figure 4a (MIA PaCa-2-Fascin cells group) and figure 4c (MIA PaCa-2-Vector cells group) showed initial distances between two side of cells (0 h), and the arrow in figure 4b (MIA PaCa-2-Fascin cells group) was short than the one in figure 4d (MIA PaCa-2-Vector cells group) in 20 h, which showed the ability of cell migration increased in the state of fascin overexpression; B: The effect of fascin overexpression on the aggregation of MIA PaCa-2 cells. Images were taken at 12 h (× 60). The heterogeneous expression of fascin resulted in a reduction in aggregation compared with control cells. a: MIA PaCa-2 Fascin cells; b: MIA PaCa-2 Vector cells.
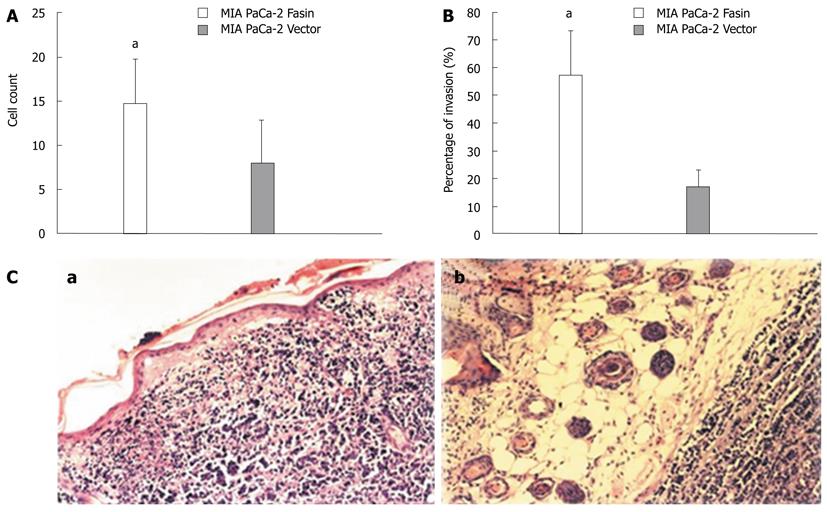
Figure 5 The effect of fascin overexpression on invasiveness of MIA PaCa-2 cells.
A: Matrigel invasion assay showed that the overexpression of fascin dramatically increased cell invasive properties compared with control cells. (aP < 0.05); B: In vivo invasion assay. Tumors from fascin-overexpressing MIA PaCa-2 Fascin cells showed an increase in skin invasion when compared with control MIA PaCa-2 Vector cells; C: Histological examination of skin invasion of tumors from MIA PaCa-2 Fascin cells and control MIA PaCa-2 cells. (a) Tumor from MIA PaCa-2 Fascin cells had skin invasion and (b) tumor from MIA PaCa-2 Vector cells showed no skin invasion (HE, × 150). HE: Hematoxylin and eosin.
- Citation: Xu YF, Yu SN, Lu ZH, Liu JP, Chen J. Fascin promotes the motility and invasiveness of pancreatic cancer cells. World J Gastroenterol 2011; 17(40): 4470-4478
- URL: https://www.wjgnet.com/1007-9327/full/v17/i40/4470.htm
- DOI: https://dx.doi.org/10.3748/wjg.v17.i40.4470


