Copyright
©2011 Baishideng Publishing Group Co.
World J Gastroenterol. Jan 28, 2011; 17(4): 459-469
Published online Jan 28, 2011. doi: 10.3748/wjg.v17.i4.459
Published online Jan 28, 2011. doi: 10.3748/wjg.v17.i4.459
Figure 1 Experimental set up.
Feeding of Bifidobacterium lactis (B. lactis)-fed donors and recipients mice were started on day -7 (D-7) until D0 for donor mice and until D27 for recipients. At D0, donor mice were sacrificed and cell transfer was performed in RAG-/- recipient mice..
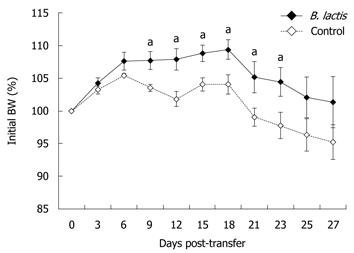
Figure 2 Bifidobacterium lactis feeding significantly delayed weight loss.
Weight curves for control-fed and Bifidobacterium lactis (B. lactis)-fed recipient mice following adoptive T cell transfer. Every three days or every other day following T cell transfer, body weight (BW) of control-fed and B. lactis-fed recipient mice was recorded. Results are expressed as the mean ± SE (n = 5 mice per group) and statistical significance is indicated (aP < 0.05).
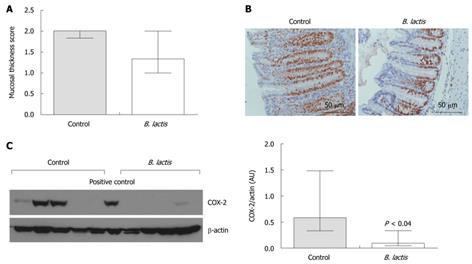
Figure 3 Histological assessment of colon inflammation for control- and Bifidobacterium lactis-fed recipient mice following adoptive T cell transfer.
A: Mucosal thickness was assessed using a specific scored graduated from 0-3. Results are expressed as the mean ± interquartile-range (IQR) (n = 5 mice per group); B: Assessment by immunostaining of the proliferation marker Ki67 (proliferating cells are characterised by the brown nuclear staining). Representative examples of longitudinal slices from colons of control colitic (left panel) and Bifidobacterium lactis (B. lactis)-fed colitic (right panel) mice are shown; C: Expression of cyclooxygenase 2 (COX-2) protein in colon tissue samples from colitic mice was quantified by Western blotting analysis (left panel). Individual expressions and relative densitometric quantification of the bands are presented (right panel). Results are expressed as the mean ± IQR (n = 5 mice per group) and statistical significances is indicated.
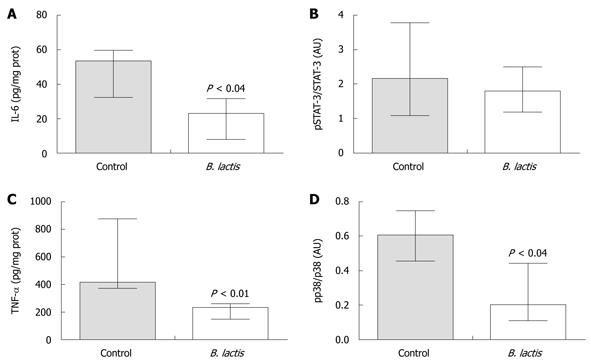
Figure 4 Bifidobacterium lactis feeding significantly diminished protein expression and phosphorylation status of pro-inflammatory markers in colon of recipient mice following adoptive T cell transfer.
Expression of interleukin-6 (IL-6) (A) and tumor necrosis factor-α (TNF-α) (C) protein was measured by enzyme-linked immunosorbent assay in colon tissue samples from colitic recipients. The ratios of phosphorylated signal transducer and activator of transcription-3 (pSTAT-3) vs STAT-3 (B) and of pp38 vs p38 (D) were assessed by Western blotting analysis in colon tissue samples of colitic mice. Relative densitometric quantifications of the Western blotting bands are presented. Results are expressed as the mean ± interquartile-range (A and C, n = 5; B, n = 3; and D, n = 4 mice per group) and statistical significance is indicated. B. lactis: Bifidobacterium lactis.
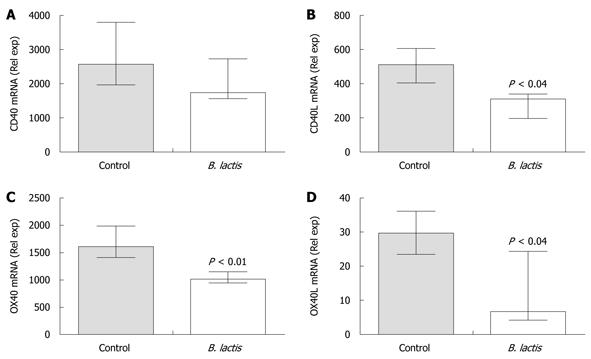
Figure 5 Bifidobacterium lactis feeding diminished the expression of mRNA coding for antigen-presenting cells and T cell costimulatory molecules in colon of recipient mice following adoptive T cell transfer.
The expressions of mRNA coding for CD40 (A), CD40 ligand (CD40L) (B), OX40 (C) and OX40 ligand (OX40L) (D) were assessed in colon samples of colitic and healthy mice by real-time polymerase chain reaction using the low density array technology. Results are expressed as the mean ± interquartile-range (n = 5 mice per group) and statistical significance is indicated. B. lactis: Bifidobacterium lactis.
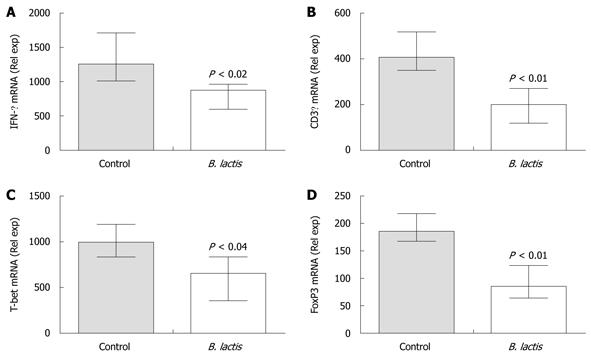
Figure 6 Bifidobacterium lactis feeding significantly diminished mRNA expression of Th1 cell markers and significantly increased mRNA expression of a Treg marker in colon of recipient mice following adoptive T cell transfer.
The expressions of mRNA coding for interferon-γ (IFN-γ) (A), CD3γ (B), T-bet (C) and FoxP3 (D) were assessed in colon samples of recipient mice by real-time polymerase chain reaction using the low density array technology. Results are expressed as the mean ± interquartile-range (n = 5 mice per group) and statistical significance is indicated. B. lactis: Bifidobacterium lactis.
-
Citation: Philippe D, Favre L, Foata F, Adolfsson O, Perruisseau-Carrier G, Vidal K, Reuteler G, Dayer-Schneider J, Mueller C, Blum S.
Bifidobacterium lactis attenuates onset of inflammation in a murine model of colitis. World J Gastroenterol 2011; 17(4): 459-469 - URL: https://www.wjgnet.com/1007-9327/full/v17/i4/459.htm
- DOI: https://dx.doi.org/10.3748/wjg.v17.i4.459


