Copyright
©2011 Baishideng Publishing Group Co.
World J Gastroenterol. Jan 28, 2011; 17(4): 459-469
Published online Jan 28, 2011. doi: 10.3748/wjg.v17.i4.459
Published online Jan 28, 2011. doi: 10.3748/wjg.v17.i4.459
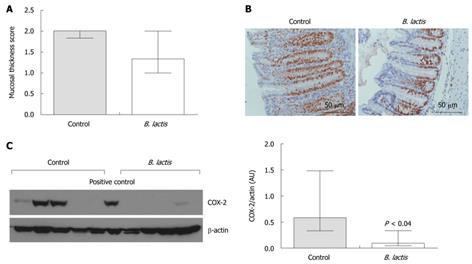
Figure 3 Histological assessment of colon inflammation for control- and Bifidobacterium lactis-fed recipient mice following adoptive T cell transfer.
A: Mucosal thickness was assessed using a specific scored graduated from 0-3. Results are expressed as the mean ± interquartile-range (IQR) (n = 5 mice per group); B: Assessment by immunostaining of the proliferation marker Ki67 (proliferating cells are characterised by the brown nuclear staining). Representative examples of longitudinal slices from colons of control colitic (left panel) and Bifidobacterium lactis (B. lactis)-fed colitic (right panel) mice are shown; C: Expression of cyclooxygenase 2 (COX-2) protein in colon tissue samples from colitic mice was quantified by Western blotting analysis (left panel). Individual expressions and relative densitometric quantification of the bands are presented (right panel). Results are expressed as the mean ± IQR (n = 5 mice per group) and statistical significances is indicated.
-
Citation: Philippe D, Favre L, Foata F, Adolfsson O, Perruisseau-Carrier G, Vidal K, Reuteler G, Dayer-Schneider J, Mueller C, Blum S.
Bifidobacterium lactis attenuates onset of inflammation in a murine model of colitis. World J Gastroenterol 2011; 17(4): 459-469 - URL: https://www.wjgnet.com/1007-9327/full/v17/i4/459.htm
- DOI: https://dx.doi.org/10.3748/wjg.v17.i4.459


