Copyright
©2011 Baishideng Publishing Group Co.
World J Gastroenterol. Oct 14, 2011; 17(38): 4298-4307
Published online Oct 14, 2011. doi: 10.3748/wjg.v17.i38.4298
Published online Oct 14, 2011. doi: 10.3748/wjg.v17.i38.4298
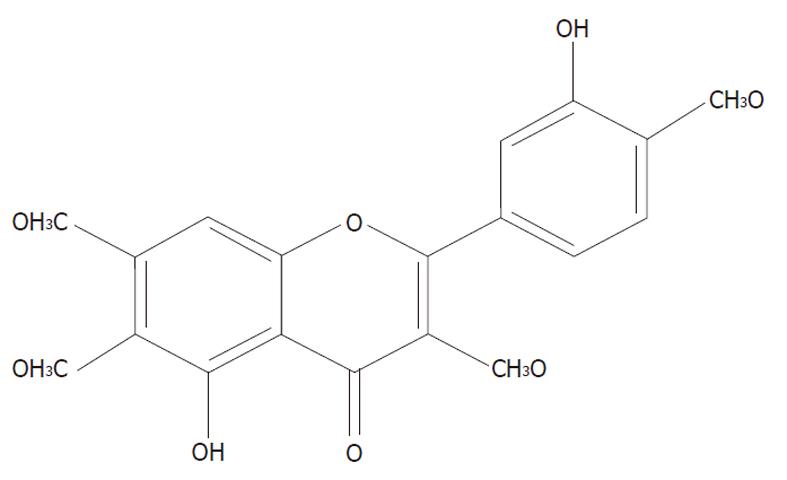
Figure 1 Chemical constitution of casticin.
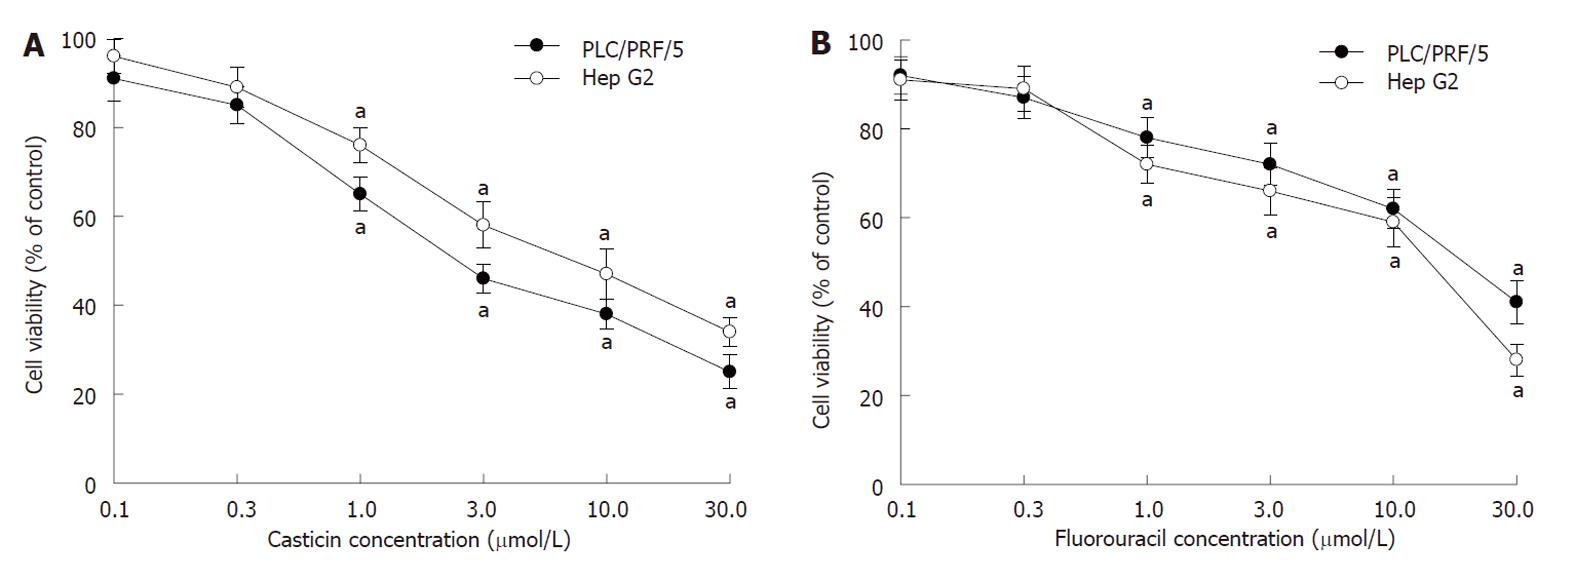
Figure 2 Effects of casticin (A) and fluorouracil (B) on the growth of hepatocellular carcinoma cells using 3-(4,5)-dimethylthiahiazo (-z-y1)-3,5-diphenytetrazoliumromide assay (mean ± SD, n = 9).
aP < 0.05 vs treatment with dimethyl-sulfoxide.
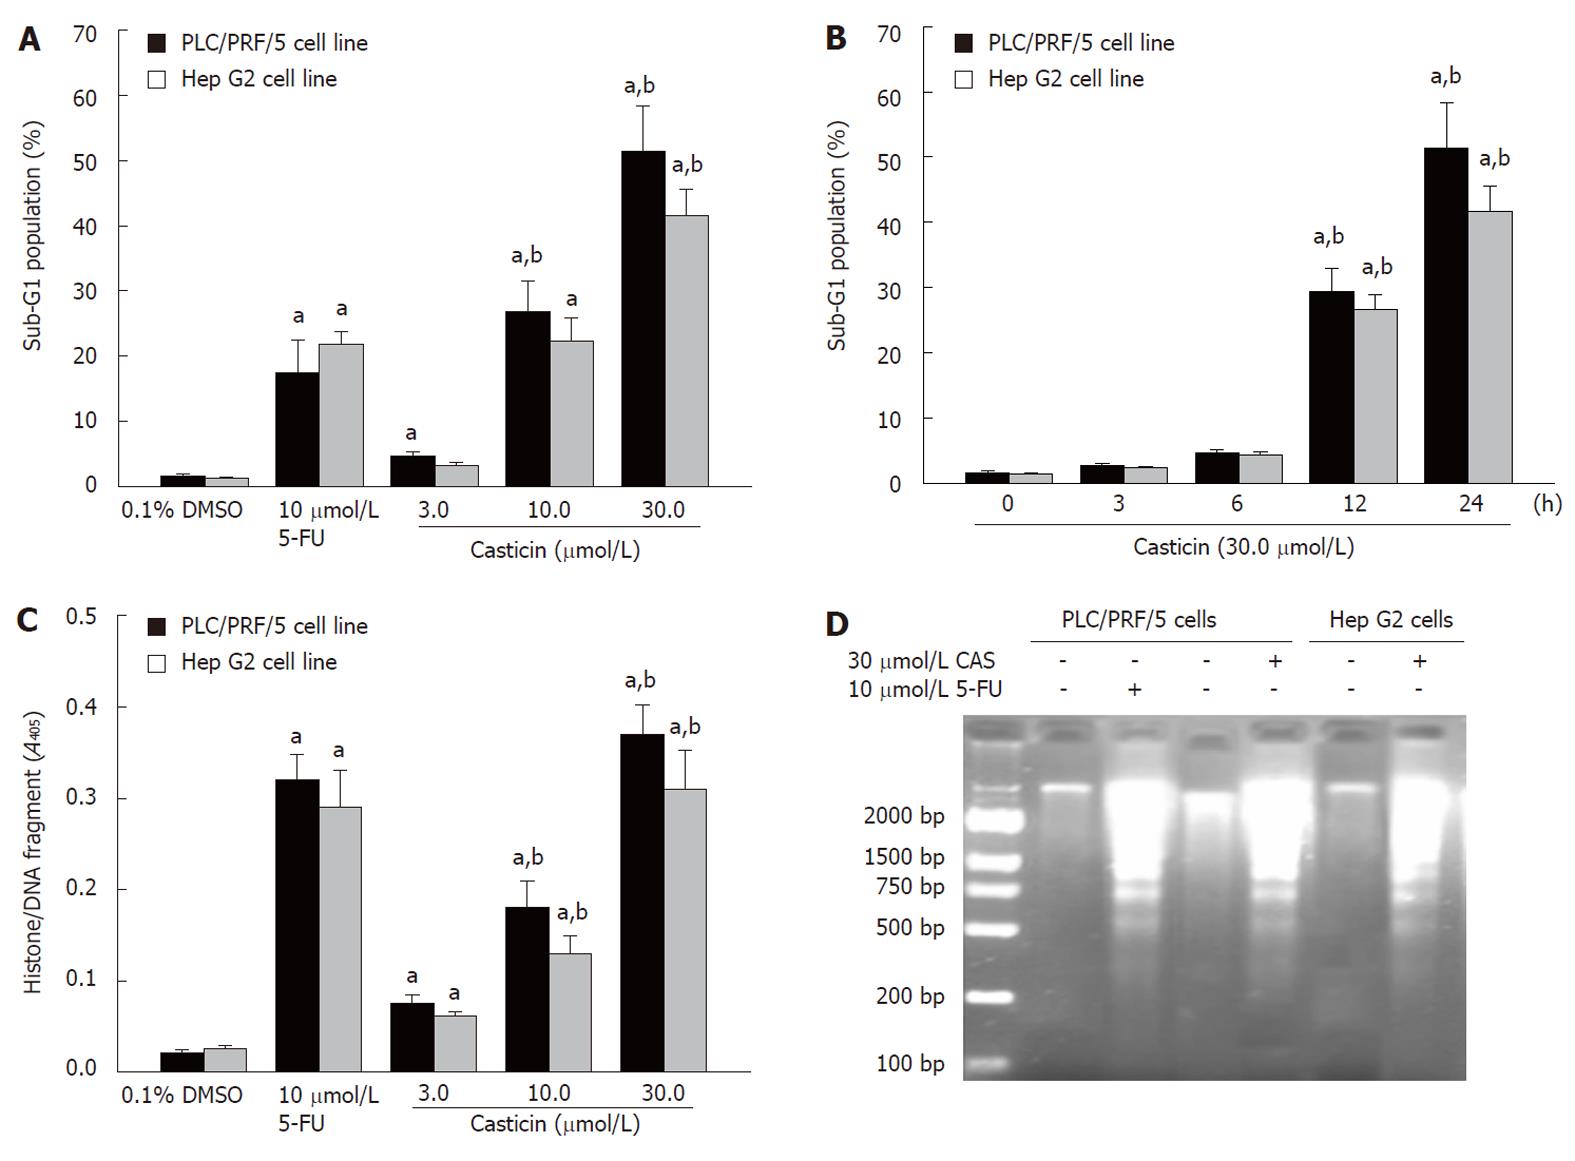
Figure 3 Effects of casticin on the percentage sub-G1 cell population (A and B), histone/DNA fragment (C) and DNA fragmentation (D) in PLC/PRF/5 and Hep G2 cells (mean ± SD, n = 3).
aP < 0.05 vs treatment with dimethyl-sulfoxide (DMSO) or 0 h; bP < 0.05 vs treatment with 3 μmol/L casticin or 6 h. 5-FU: 5-fluorouracil.
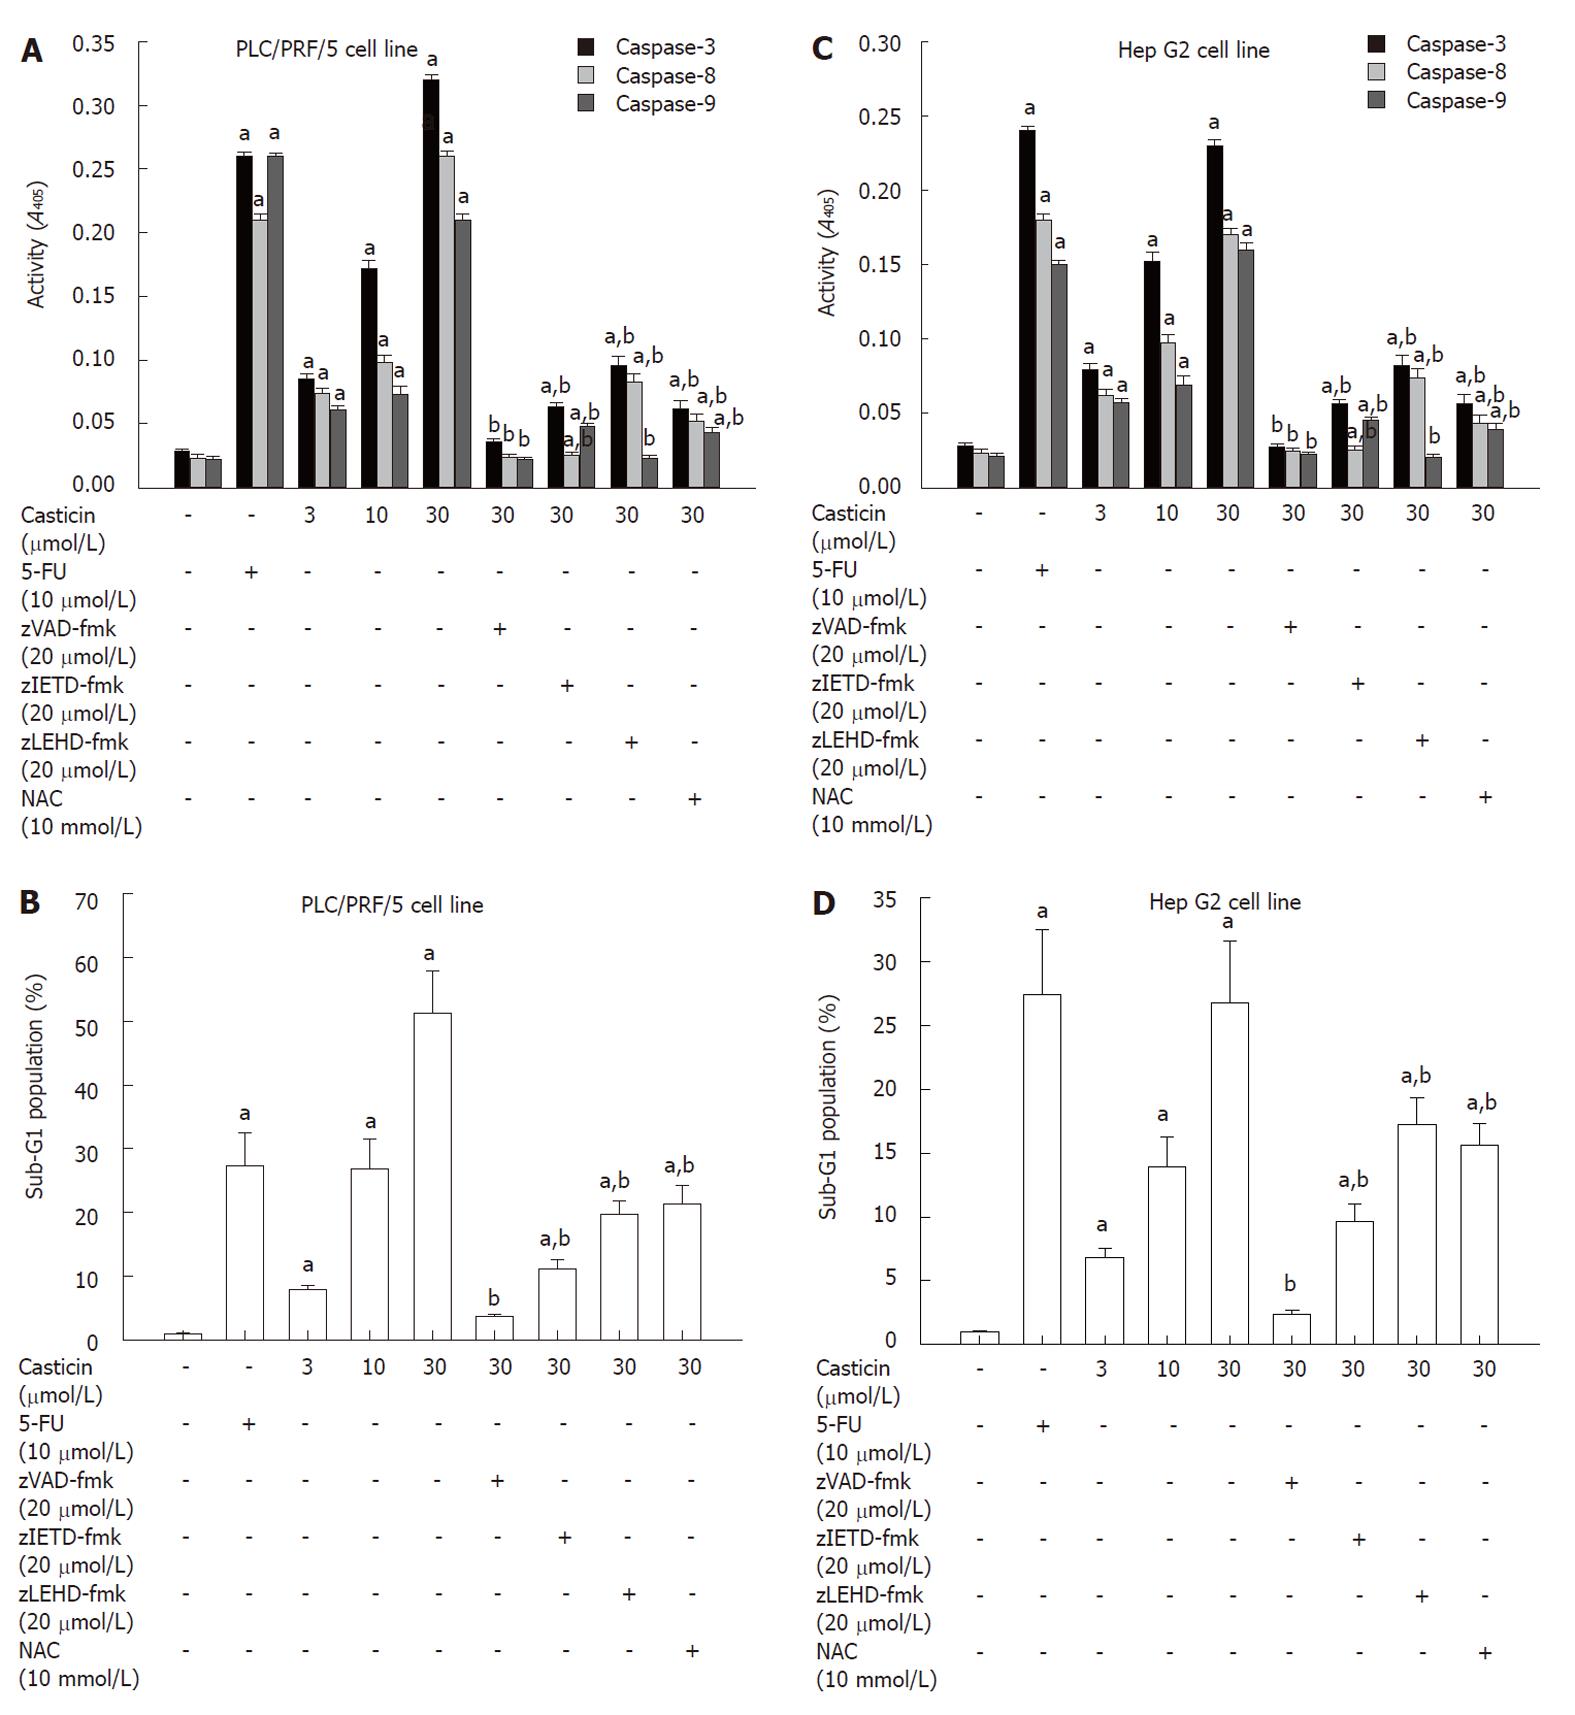
Figure 4 Effects of casticin on the activities of caspases (A and C) and the percentage sub-G1 cell population (B and D) in PLC/PRF/5 and Hep G2 cells (mean ± SD, n = 3).
aP < 0.05 vs treatment with dimethyl-sulfoxide (DMSO); bP < 0.05 vs treatment with 30 μmol/L casticin alone. 5-FU: 5-fluorouracil; NAC: N-acetyl-cysteine.
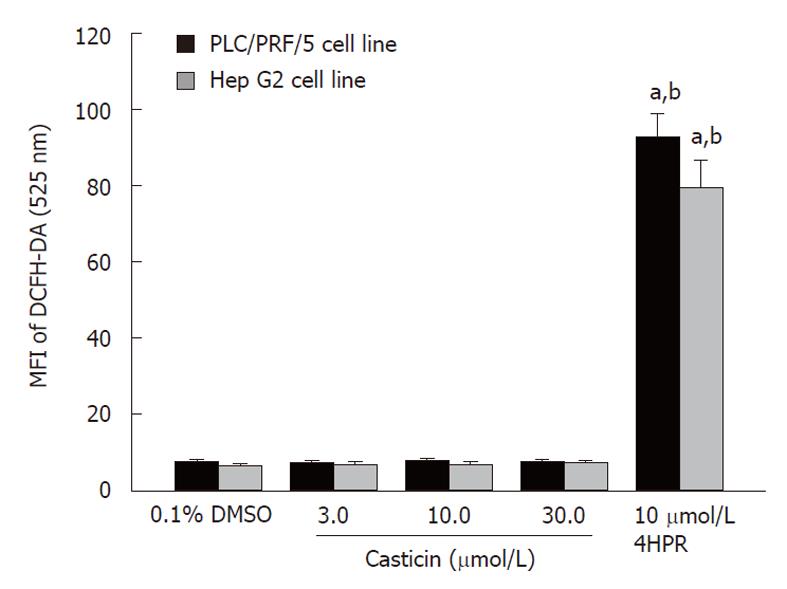
Figure 5 Effects of casticin on the production of reactive oxygen species in PLC/PRF/5 and Hep G2 cells (mean ± SD, n = 3).
aP < 0.05 vs treatment with dimethyl-sulfoxide (DMSO); bP < 0.05 vs treatment with 30 μmol/L casticin. 4HPR: N-(4-hydroxyphenyl) retinamide.
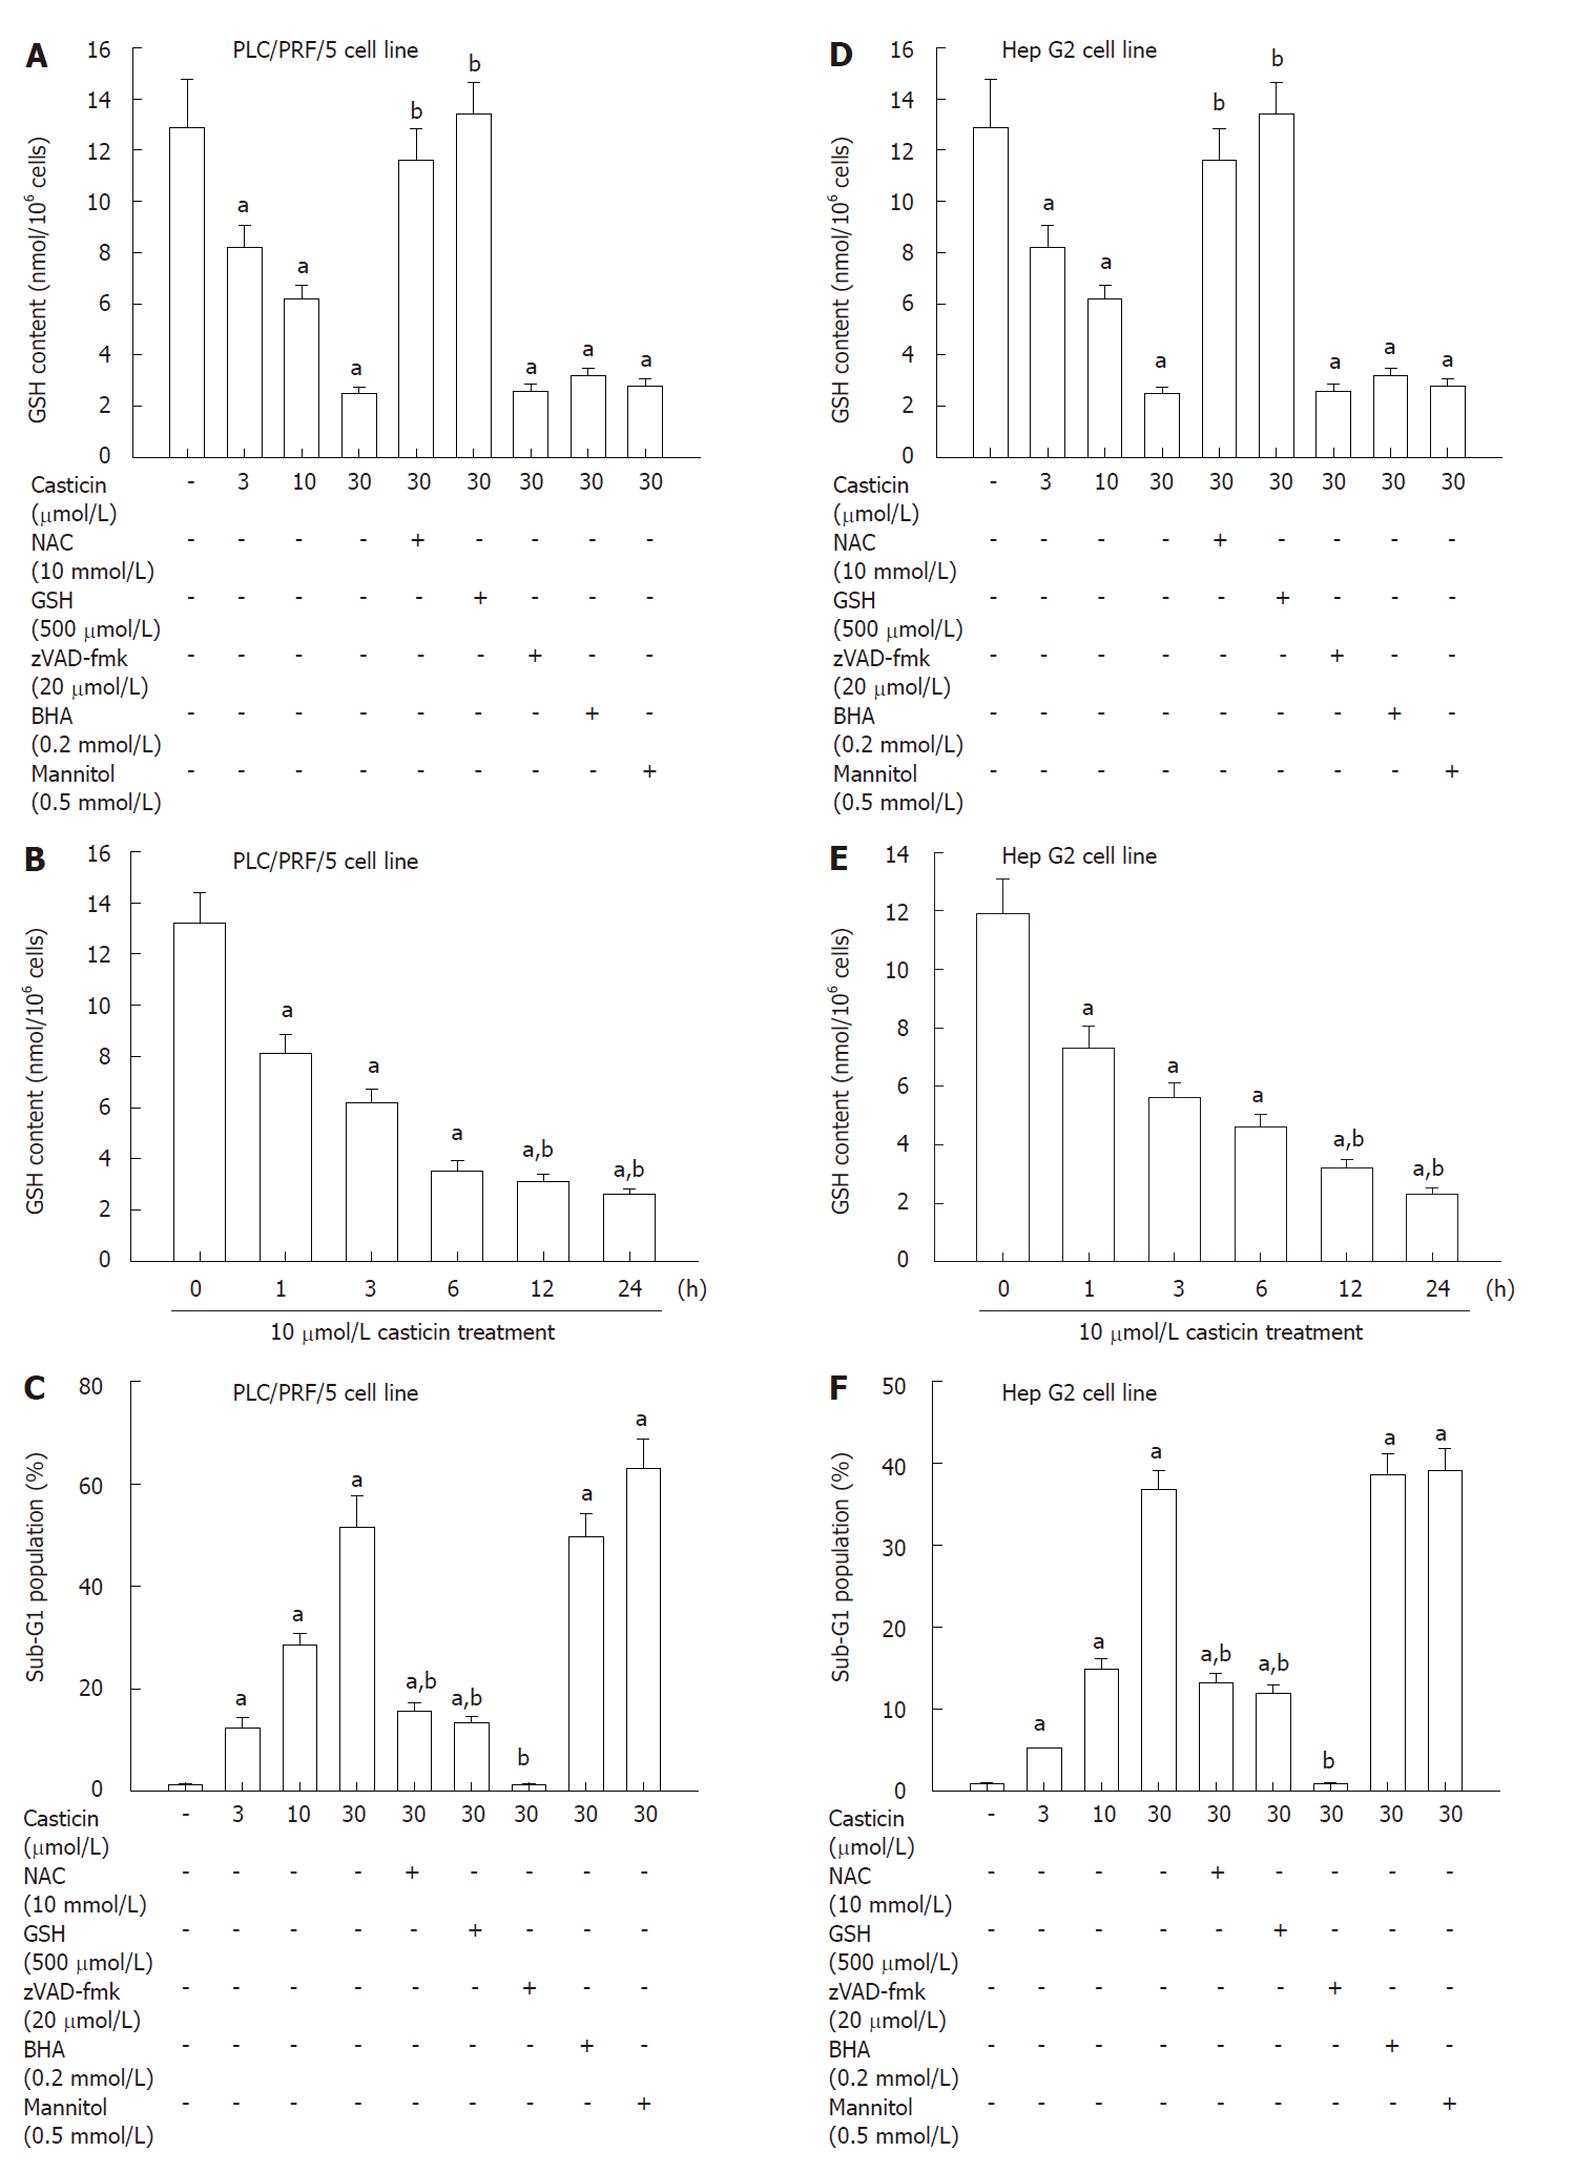
Figure 6 Effects of casticin on intracellular glutathione content (A, B and D, E) and the percentage sub-G1 cell population (C and F) in PLC/PRF/5 and Hep G2 cells (mean ± SD, n = 3).
aP < 0.05 vs treatment with dimethyl-sulfoxide (DMSO) or 0 h; bP < 0.05 vs treatment with 30 μmol/L casticin alone or treatment with 10 μmol/L casticin for 1 h. GSH: Glutathione; BHA: Butylated hydroxyanisole; NAC: N-acetyl-cysteine.
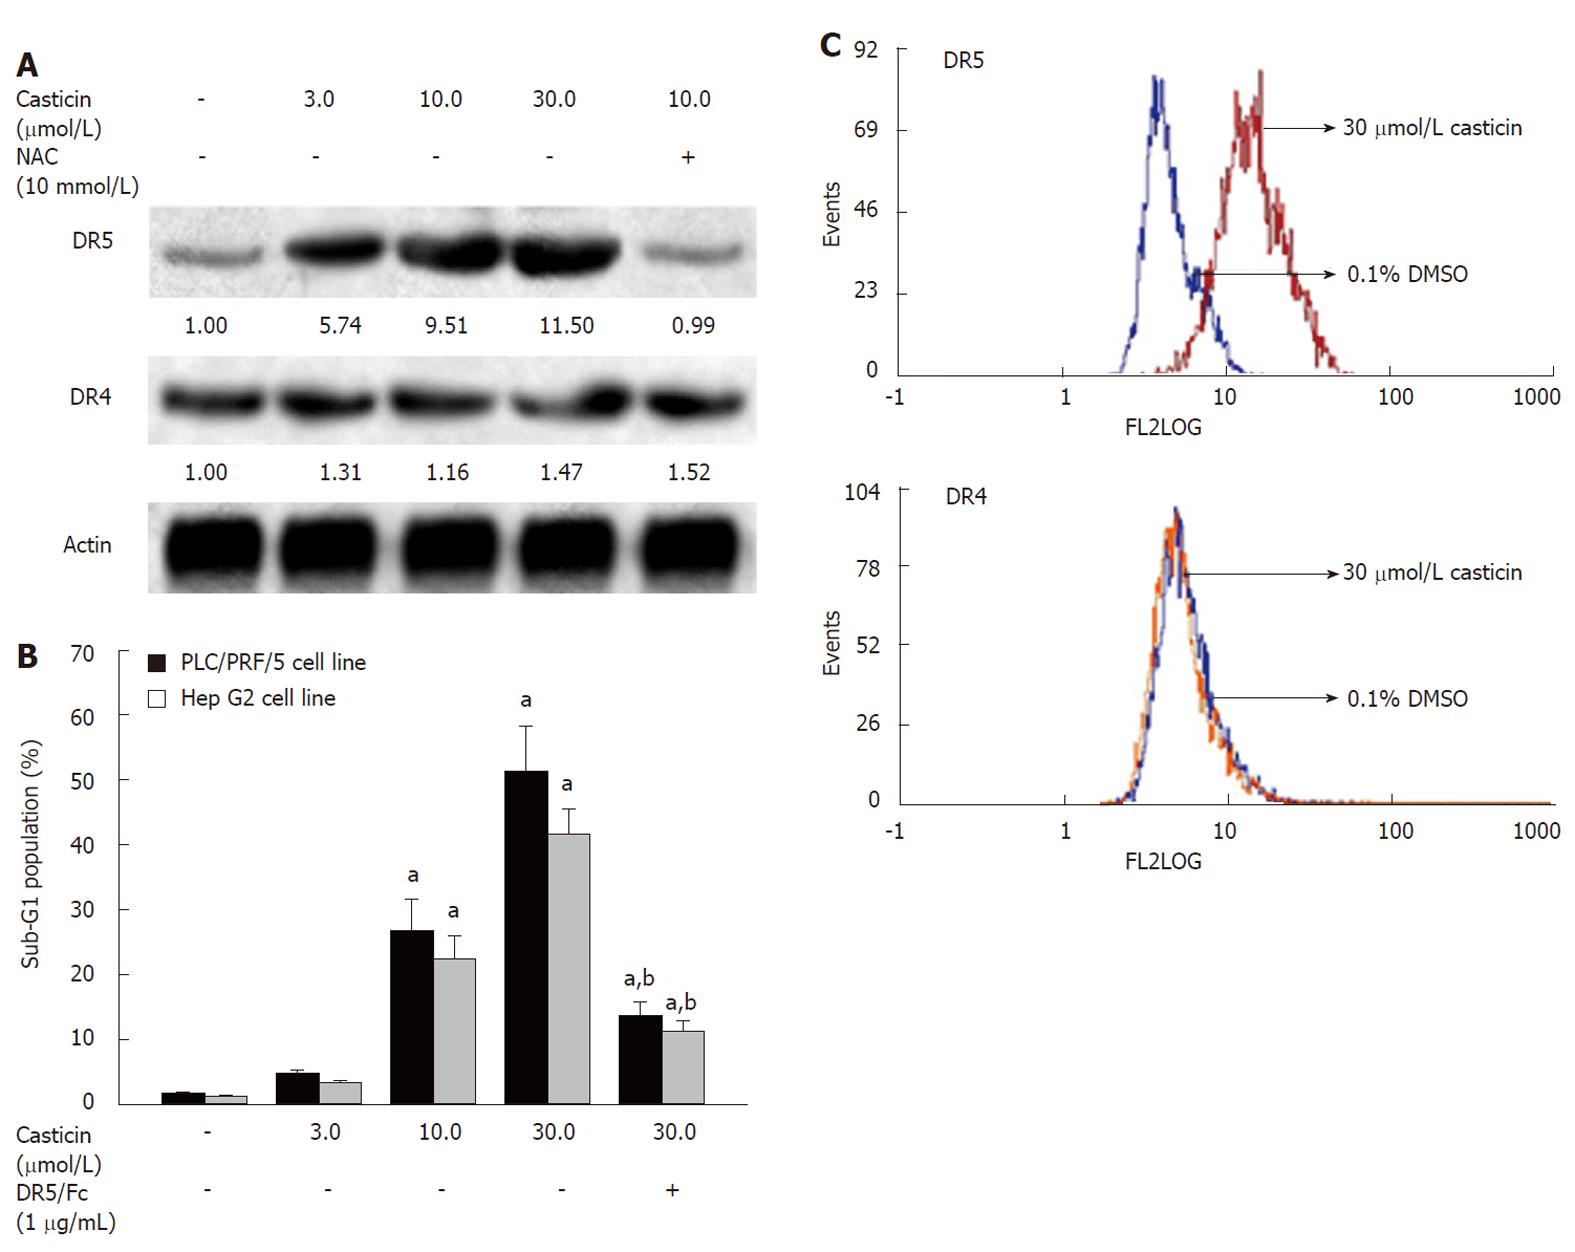
Figure 7 Effects of casticin on the levels of death receptors (DR4 and DR5) expression(A) using Western blotting and the percentage sub-G1 cell population (B) in PLC/PRF/5 cells (mean ± SD, n = 3).
aP < 0.05 vs treatment with dimethyl-sulfoxide (DMSO); bP < 0.05 vs treatment with 30 μmol/L casticin alone. C: Effects of casticin on the levels of death receptor (DR)4 and DR5 protein levels on the surface of Hep G2 cells using flow cytometry. NAC: N-acetyl-cysteine.
- Citation: Yang J, Yang Y, Tian L, Sheng XF, Liu F, Cao JG. Casticin-induced apoptosis involves death receptor 5 upregulation in hepatocellular carcinoma cells. World J Gastroenterol 2011; 17(38): 4298-4307
- URL: https://www.wjgnet.com/1007-9327/full/v17/i38/4298.htm
- DOI: https://dx.doi.org/10.3748/wjg.v17.i38.4298


