Copyright
©2011 Baishideng Publishing Group Co.
World J Gastroenterol. Sep 21, 2011; 17(35): 4038-4043
Published online Sep 21, 2011. doi: 10.3748/wjg.v17.i35.4038
Published online Sep 21, 2011. doi: 10.3748/wjg.v17.i35.4038
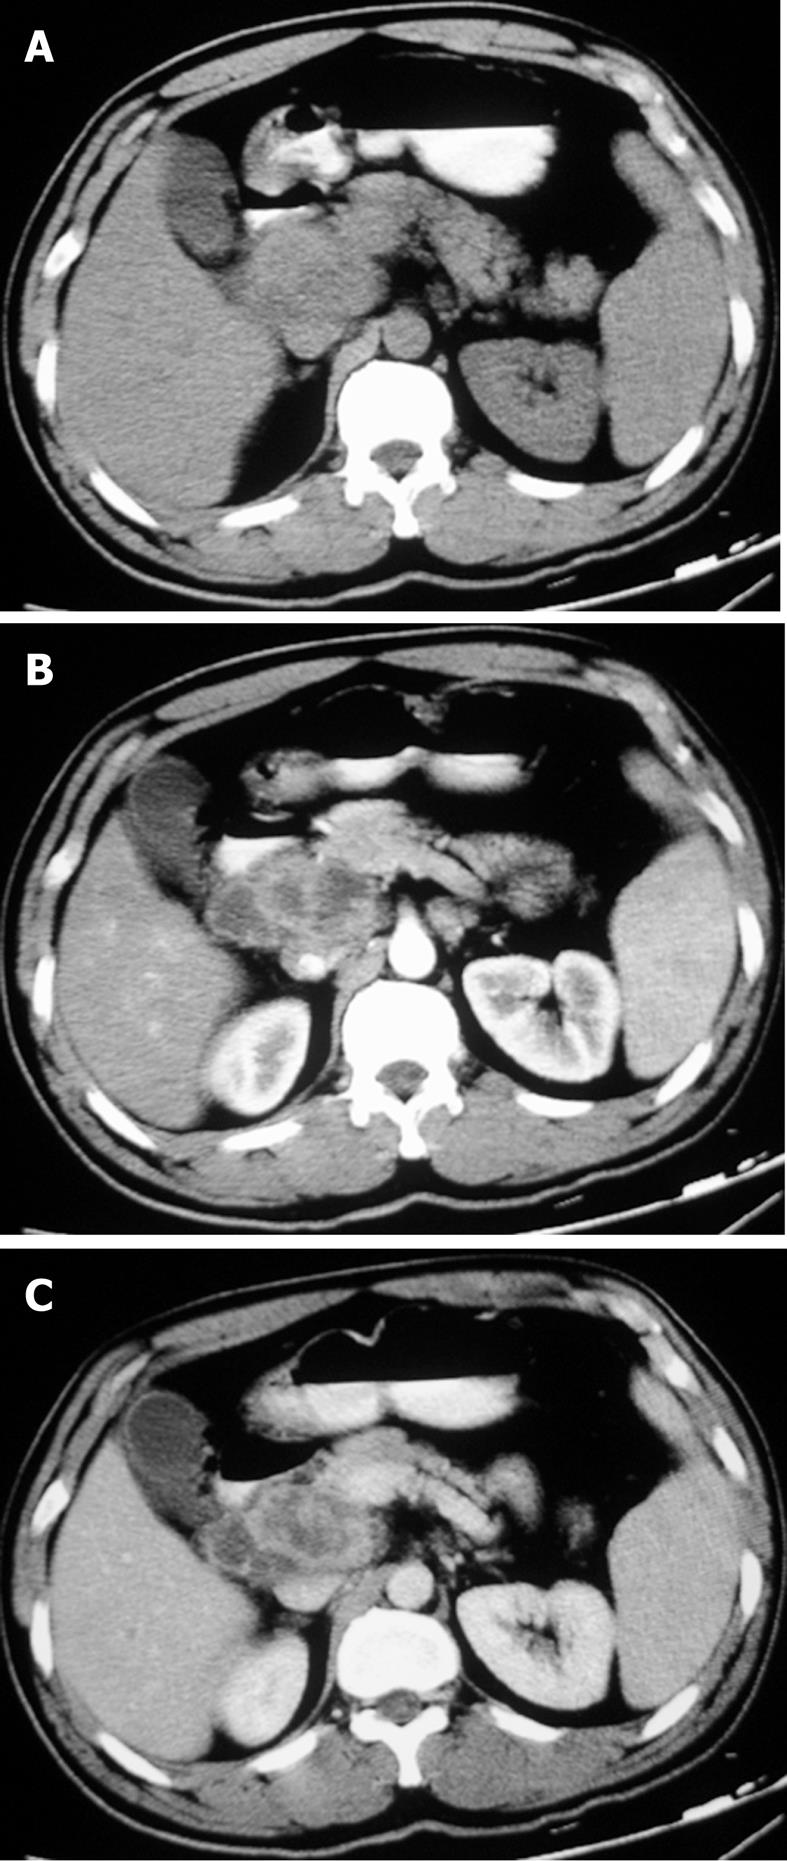
Figure 1 Peripancreatic tuberculous lymphadenopathy.
A: Plain computed tomography (CT) showing peripancreatic, lobular, and slightly uneven density mass; B, C: Contrast-enhanced CT of the arterial phase (B) and portal venous phase (C) showing the mass with irregular peripheral enhancement.
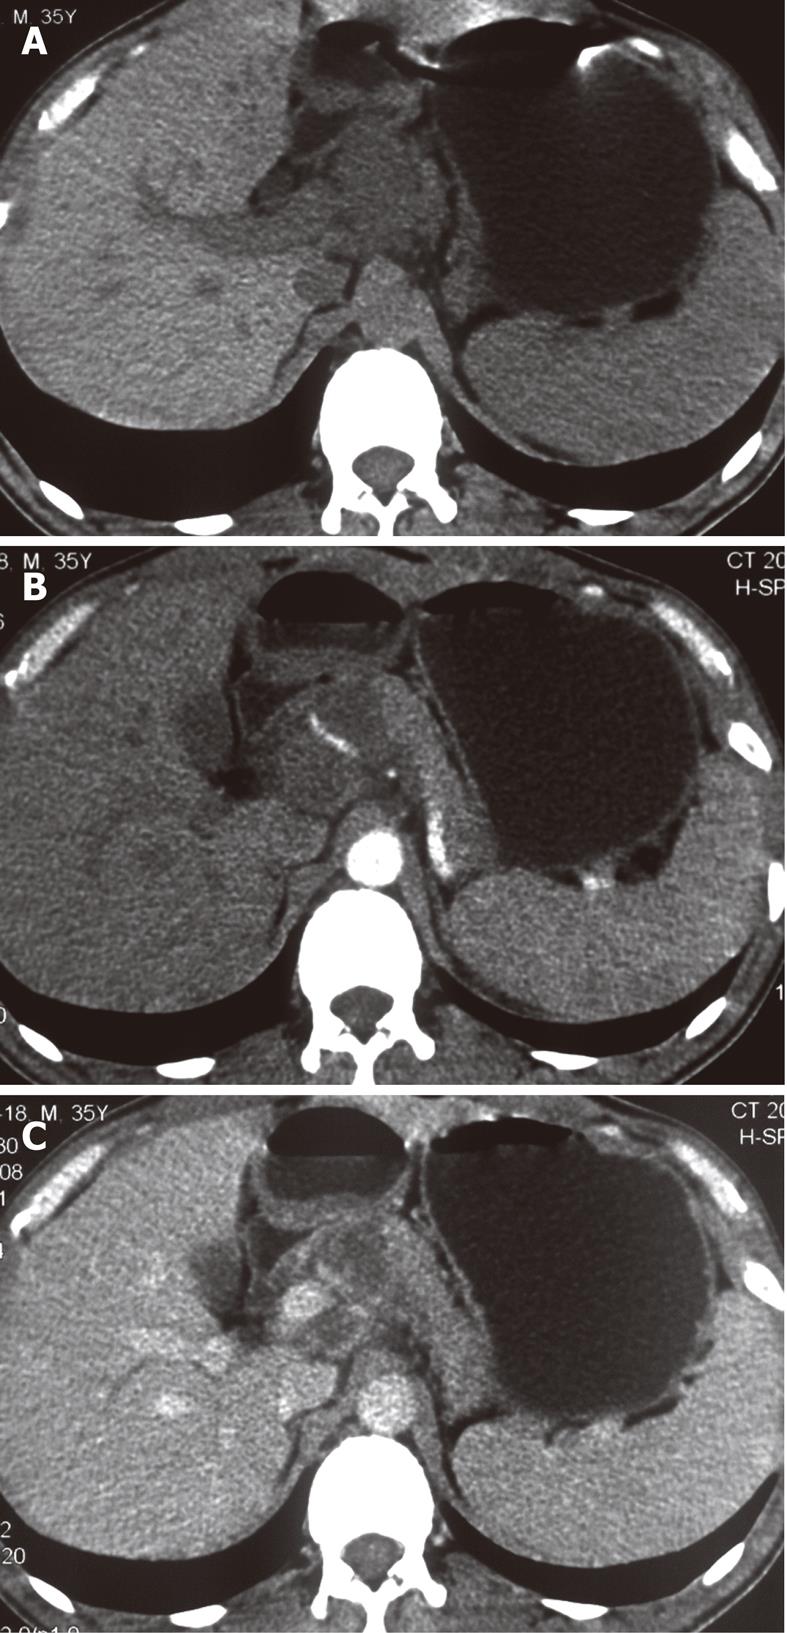
Figure 2 Peripancreatic tuberculous lymphadenopathy.
A: Plain computed tomography (CT) showing peripancreatic, lobular, and low density mass; B, C: Contrast-enhanced CT of the arterial phase (B) and portal venous phase (C) showing the mass with slight peripheral enhancement and the encased common hepatic artery.
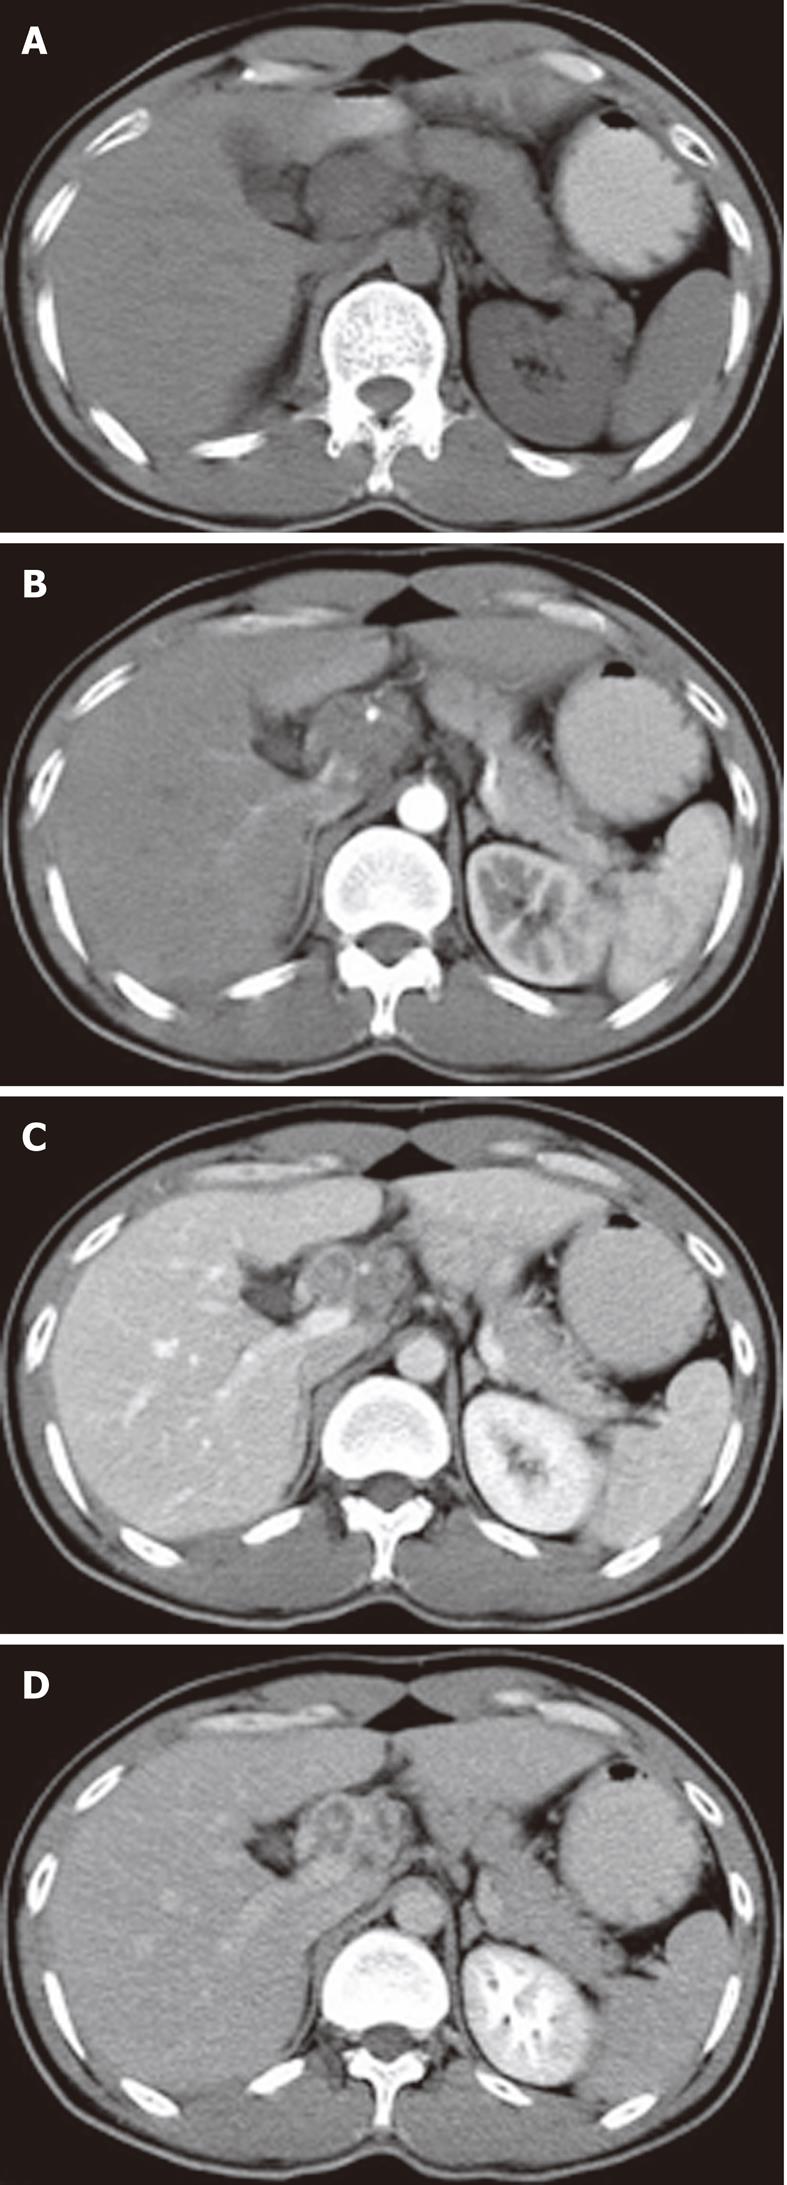
Figure 3 Periportal tuberculous lymphadenopathy.
A: Plain computed tomography scan showing hypodense masses in the hepatic portal region; B-D: After injection of contrast material, continuing peripheral enhancement allows individual lymph nodes to be defined, and the common hepatic artery was embedded within the lesion without definite evidence of stenosis.
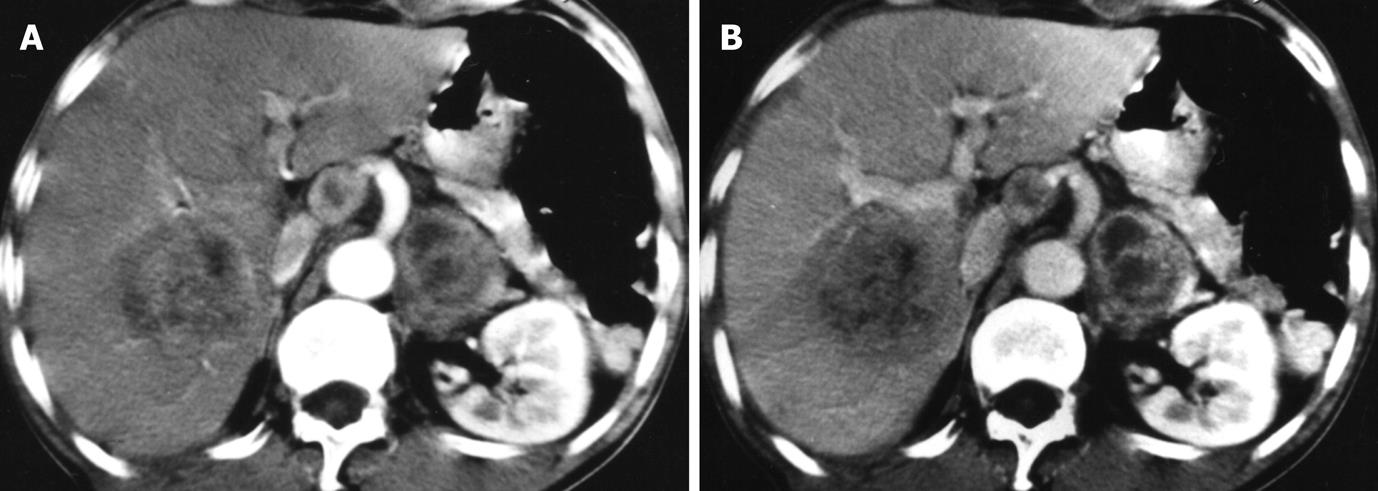
Figure 4 Hepatic tuberculosis and periaortic tuberculous lymphadenopathy.
A, B: The lesions within the liver and periaorta show similar irregular rim enhancement on the arterial phase (A) and portal venous phase (B) of contrast-enhanced computed tomography.
- Citation: Zhang M, Li M, Xu GP, Liu HJ. Neoplasm-like abdominal nonhematogenous disseminated tuberculous lymphadenopathy: CT evaluation of 12 cases and literature review. World J Gastroenterol 2011; 17(35): 4038-4043
- URL: https://www.wjgnet.com/1007-9327/full/v17/i35/4038.htm
- DOI: https://dx.doi.org/10.3748/wjg.v17.i35.4038


