Copyright
©2011 Baishideng Publishing Group Co.
World J Gastroenterol. Aug 7, 2011; 17(29): 3453-3458
Published online Aug 7, 2011. doi: 10.3748/wjg.v17.i29.3453
Published online Aug 7, 2011. doi: 10.3748/wjg.v17.i29.3453
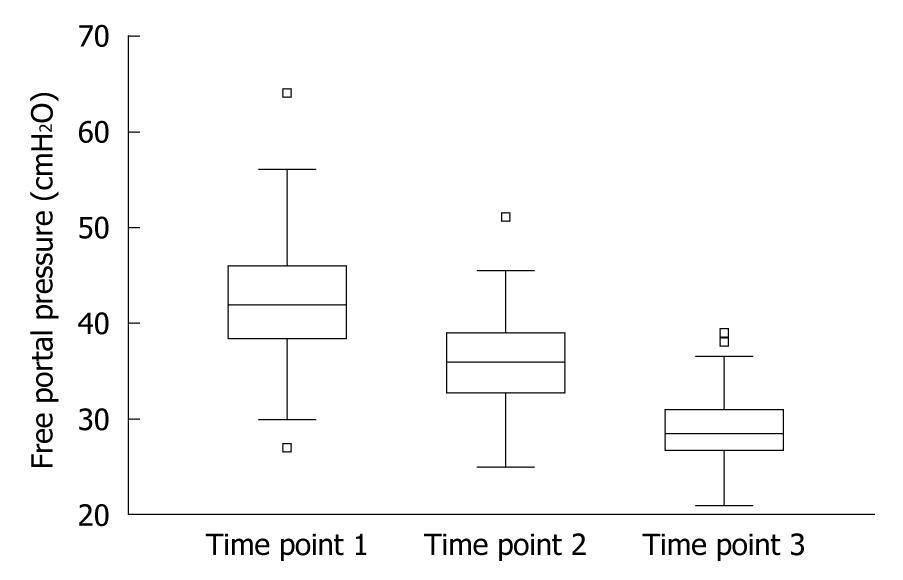
Figure 1 Change of portal pressure during operation (n = 98).
Time point 1: Before splenectomy; Time point 2: After splenectomy and before shunting; Time point 3: After shunting.
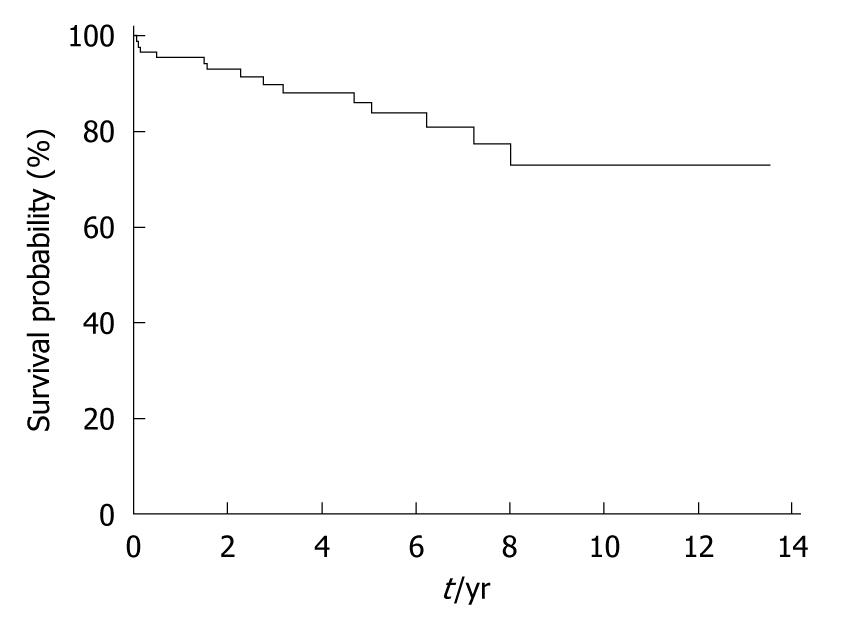
Figure 2 Survival curve for 91 patients undergoing small-diameter proximal splenorenal venous shunting.
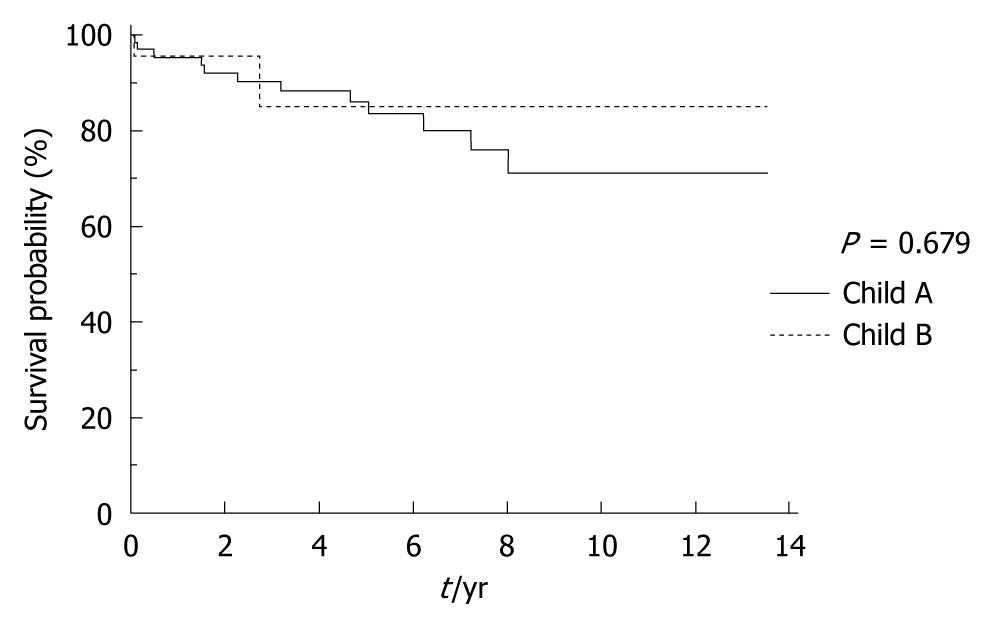
Figure 3 Comparison of survival curve for patients with Child A and Child B variceal hemorrhage undergoing small-diameter proximal splenorenal venous shunting.
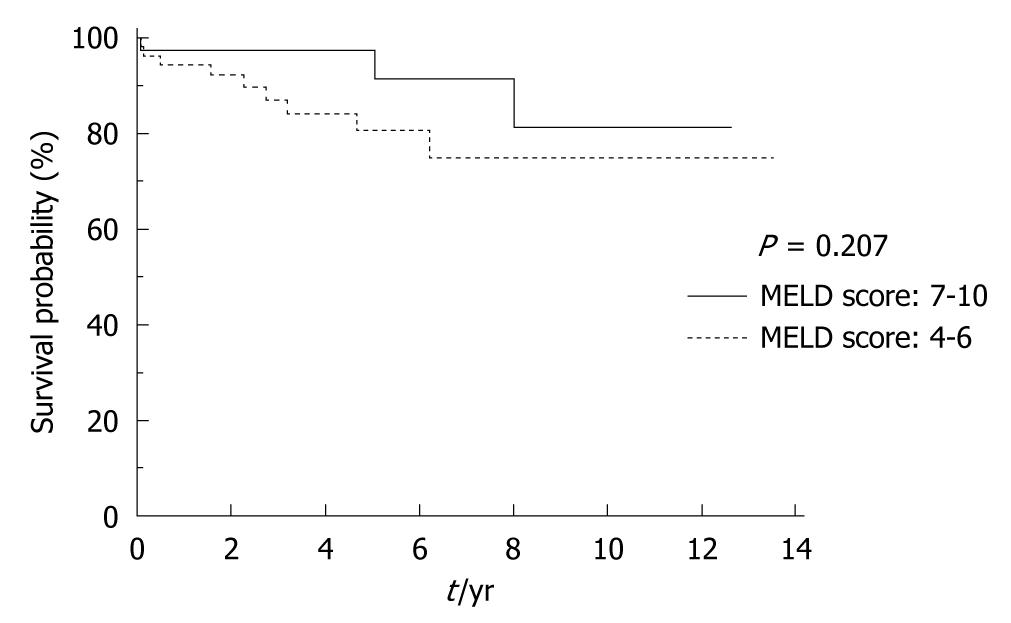
Figure 4 Comparison of survival curve by model for end-stage liver disease scoring in patients undergoing small-diameter proximal splenorenal venous shunting.
MELD: Model for end-stage liver disease.
- Citation: Chen H, Yang WP, Yan JQ, Li QY, Ma D, Li HW. Long-term results of small-diameter proximal splenorenal venous shunt: A retrospective study. World J Gastroenterol 2011; 17(29): 3453-3458
- URL: https://www.wjgnet.com/1007-9327/full/v17/i29/3453.htm
- DOI: https://dx.doi.org/10.3748/wjg.v17.i29.3453


