Copyright
©2011 Baishideng Publishing Group Co.
World J Gastroenterol. Aug 7, 2011; 17(29): 3407-3419
Published online Aug 7, 2011. doi: 10.3748/wjg.v17.i29.3407
Published online Aug 7, 2011. doi: 10.3748/wjg.v17.i29.3407
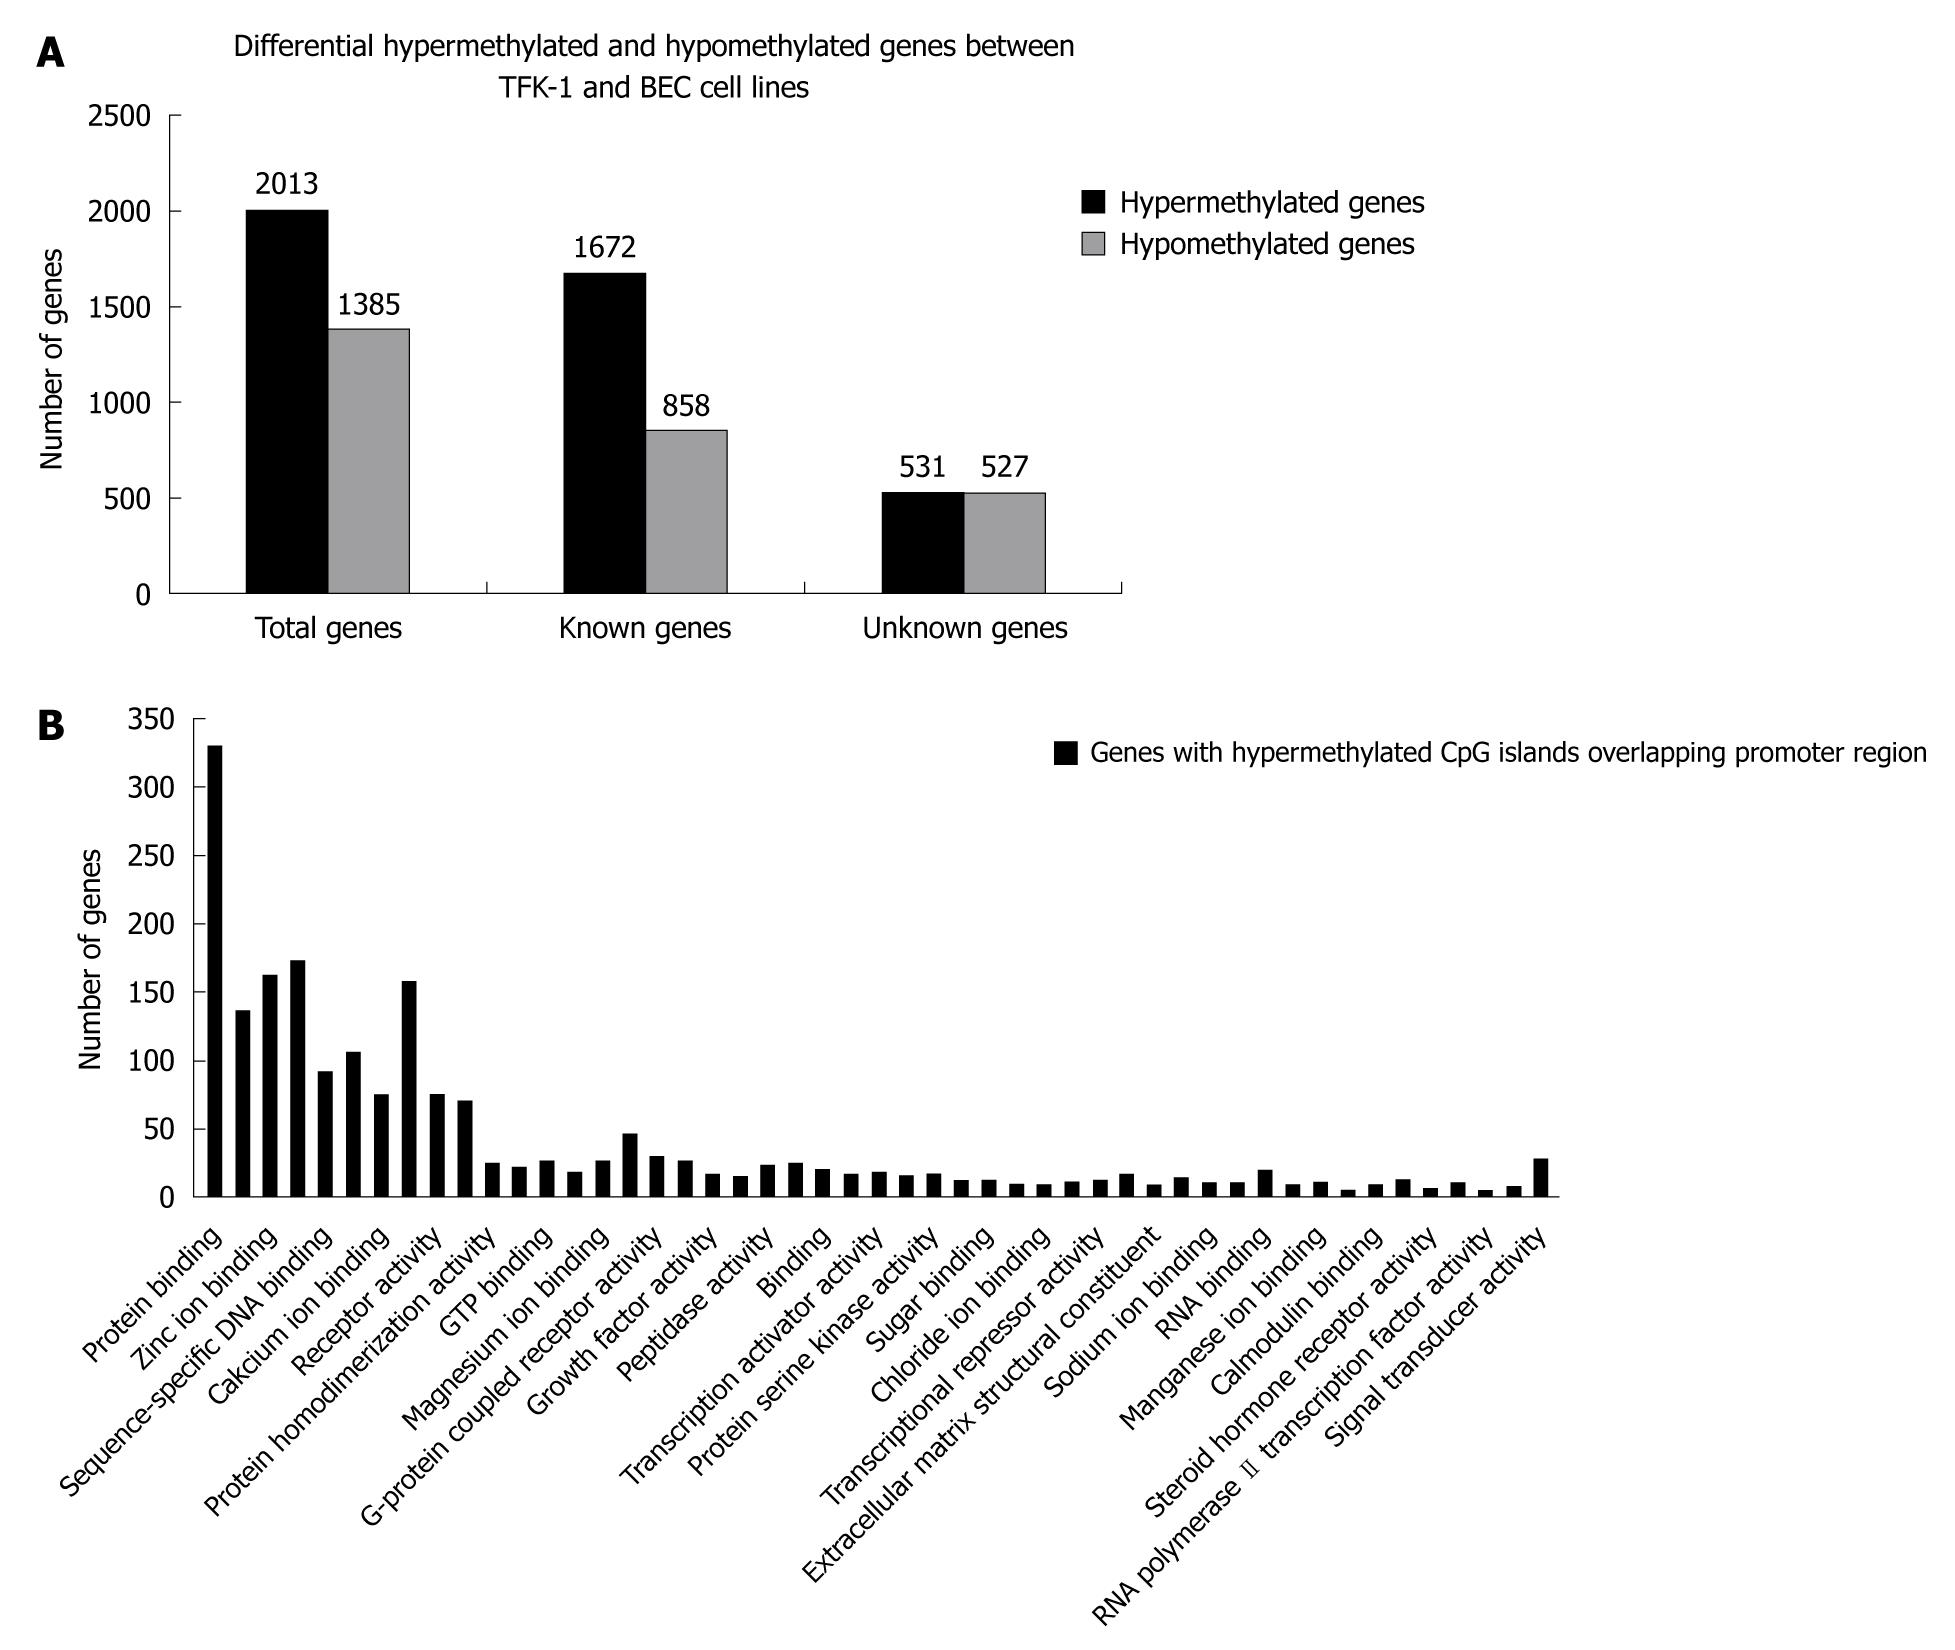
Figure 1 Identification of differentially hypo- or hypermethylated genes by Methylated DNA Immunoprecipitation and functional analysis of differentially hypermethylated genes by Molecule Annotation System.
A: Differentially hypermethylated and hypomethylated genes between TFK-1 and bile duct epithelial cells (BEC) cell lines; B: Functional categories of differentially hypermethylated genes identified by the Molecule Annotation System.
Figure 2 DNA methylation analyses of CpG islands of hypermethylated HOX genes.
A: Graphical representation of Methylated DNA Immunoprecipitation microarray (Signalmap software, NimbleGen). The panels show the DNA methylation profile at homeobox cluster genes in normal epithelial cell of bile duct cell line bile duct epithelial cells (BEC) and cholangiocarcinoma cell line TFK-1. The methylated CpG islands are indicated by bar and arrow in TFK-1 (red) and BEC (green). Chromosomal location is indicated at the top of the diagram; B: Bisulfate-sequencing of HOXA2, HOXA5, HOXA11, HOXB4 and HOXD13. Each vertical line represents a single CpG site on the top. The regions were analyzed by bisulfate-sequencing. The transcription start site and location of exon 1 are shown by thick bars on the bottom. Each row represents an individual cloned allele. Circles represent CpG sites and their spacing accurately reflects the CpG density of the region. Black circles, methylated CpG site; white circles, unmethylated CpG site. Dense methylation at the promoters was found in TFK-1. In contrast, promoter hypomethylation found in BEC among all the genes.
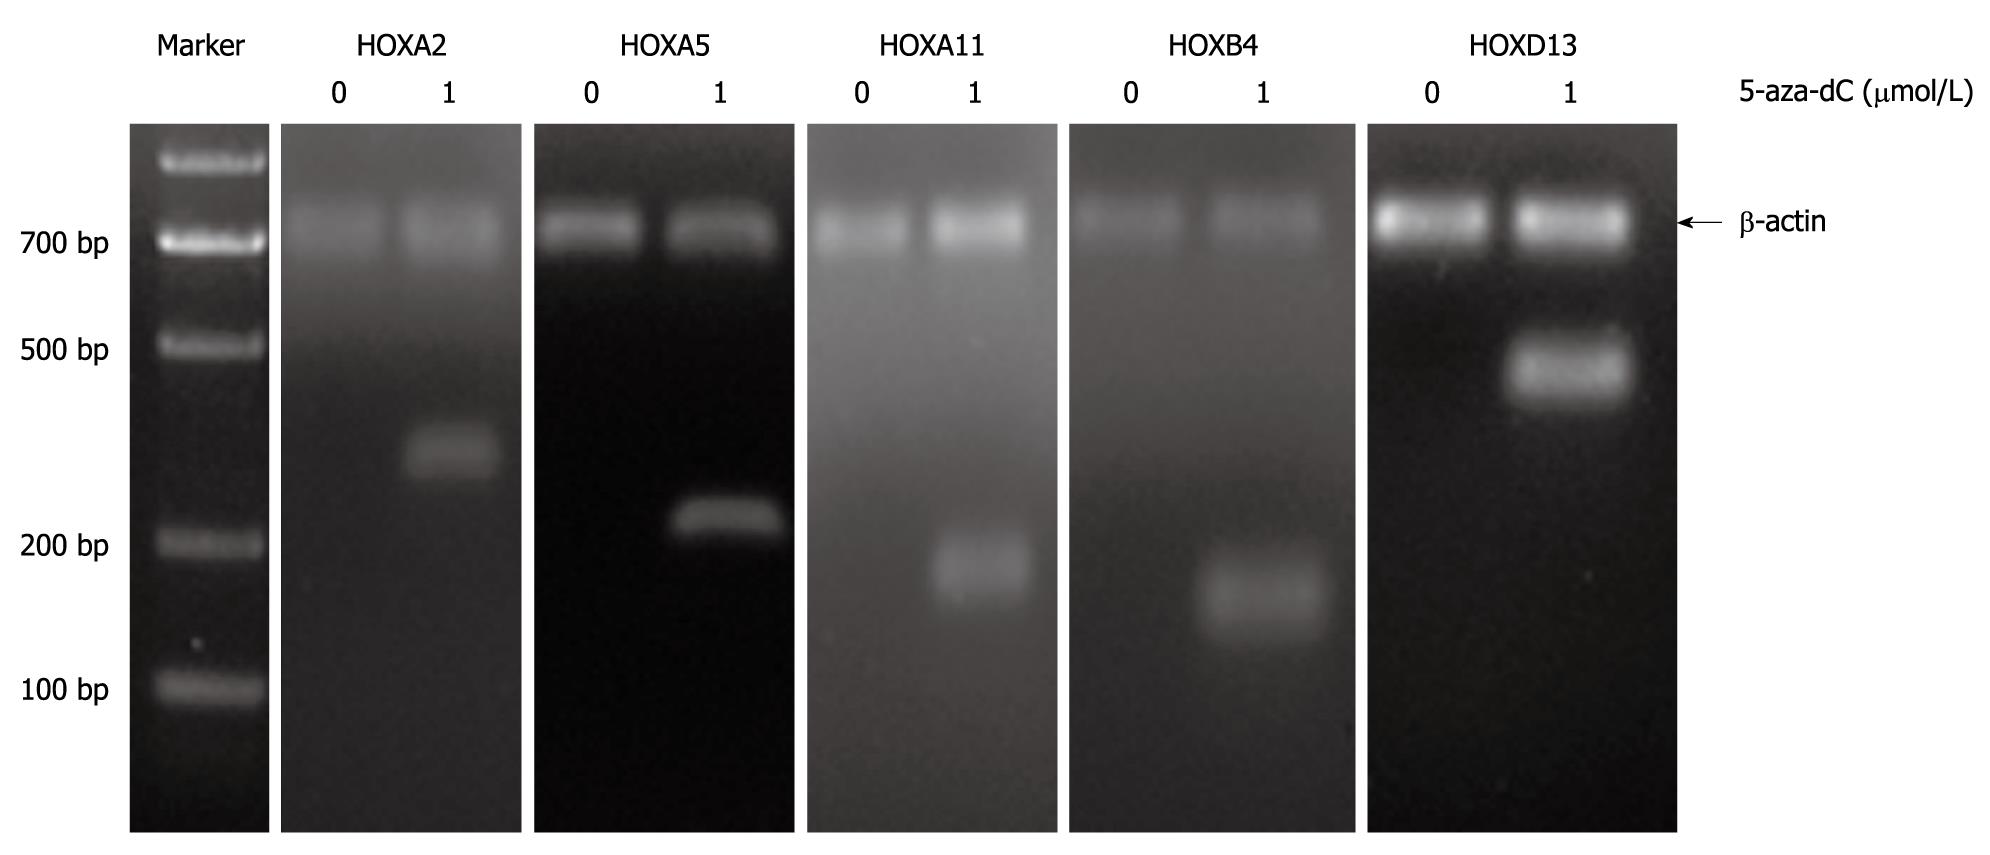
Figure 3 Reverse transcription-polymerase chain reaction analysis for expression profile of HOXA2, HOXA5, HOXA11, HOXB4 and HOXD13 in TFK-1 cells before and after the treatment with demethylating agent 5-aza-2-deoxycytidine (5-aza-dC).
Loss of expression of genes was observed before the treatment in TFK-1. Re-expression of genes was observed upon the treatment with 1 μmol/L demethylating agent 5-aza-2-deoxycytidine (5-aza-dC). TFK-1 cells were subjected to the 1 μmol/L 5-aza-dC treatment for 3 d before RNA prepared for reverse transcription-polymerase chain reaction assessment. β-actin 700 bp.
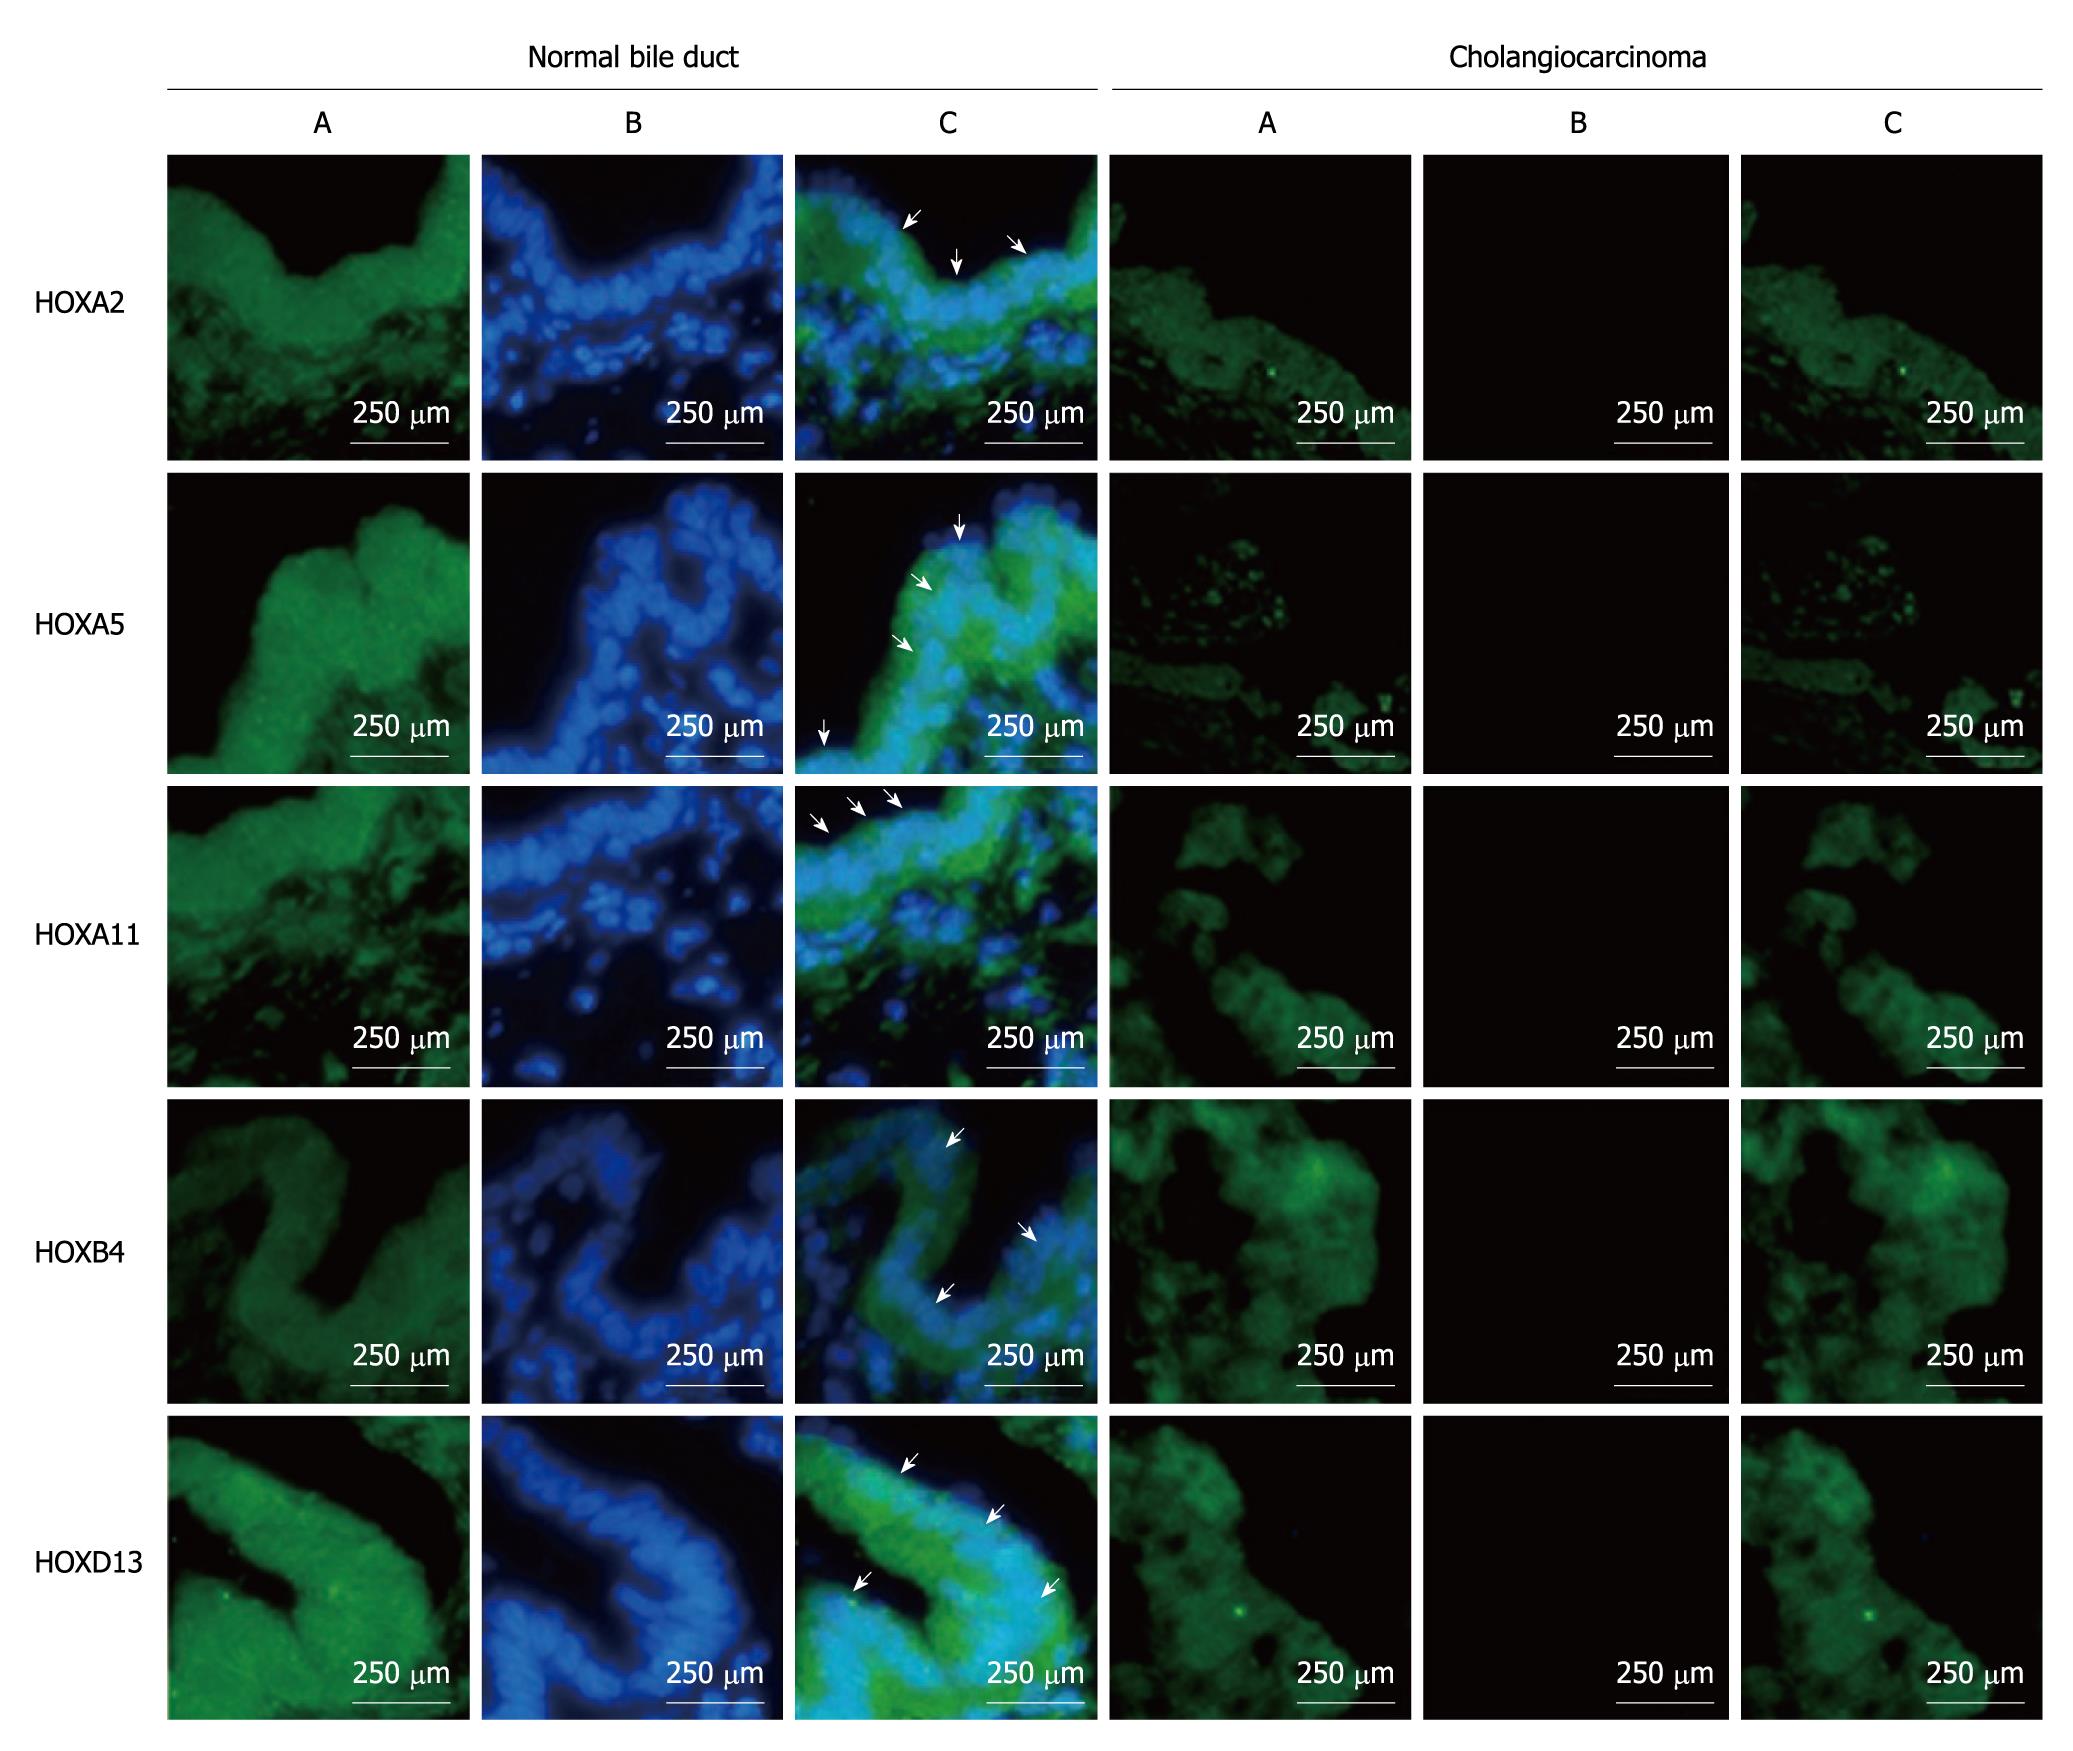
Figure 4 Expression of HOXA2, HOXA5, HOXA11, HOAB4, HOXD13 in extra-hepatic cholangiocarcinoma by immunofluorescence.
Green channel is nuclear staining by 4’,6-diamidiono-2-phenylindole (DAPI) (A), blue channel is the target gene (B), and overlay of DAPI and target genes (C). Arrows indicate the positive target genes in specimens.
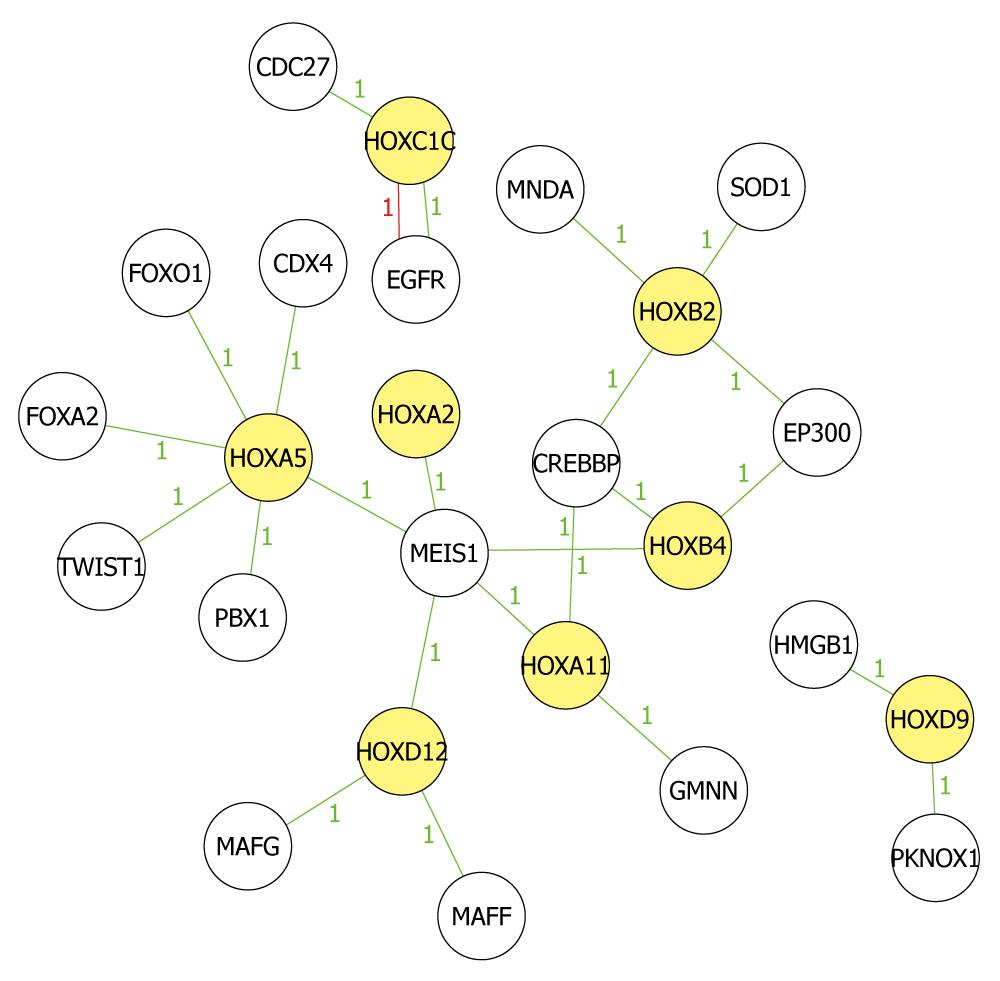
Figure 5 Network analysis of known biological relationships between HOX genes and their related genes.
Network analysis was performed and produced by Molecule Annotation System. Yellow icons indicate methylated Hox genes and colorless icons indicate methylated non-HOX genes, which have been demonstrated to be related to Hox genes in other studies. Green lines indicate high correlation and red lines indicate low correlation. All present hypermethylated status in the microarray results. Number between icons indicates the relationship mentioned in the reports.
- Citation: Shu Y, Wang B, Wang J, Wang JM, Zou SQ. Identification of methylation profile of HOX genes in extrahepatic cholangiocarcinoma. World J Gastroenterol 2011; 17(29): 3407-3419
- URL: https://www.wjgnet.com/1007-9327/full/v17/i29/3407.htm
- DOI: https://dx.doi.org/10.3748/wjg.v17.i29.3407


