Copyright
©2011 Baishideng Publishing Group Co.
World J Gastroenterol. Aug 7, 2011; 17(29): 3407-3419
Published online Aug 7, 2011. doi: 10.3748/wjg.v17.i29.3407
Published online Aug 7, 2011. doi: 10.3748/wjg.v17.i29.3407
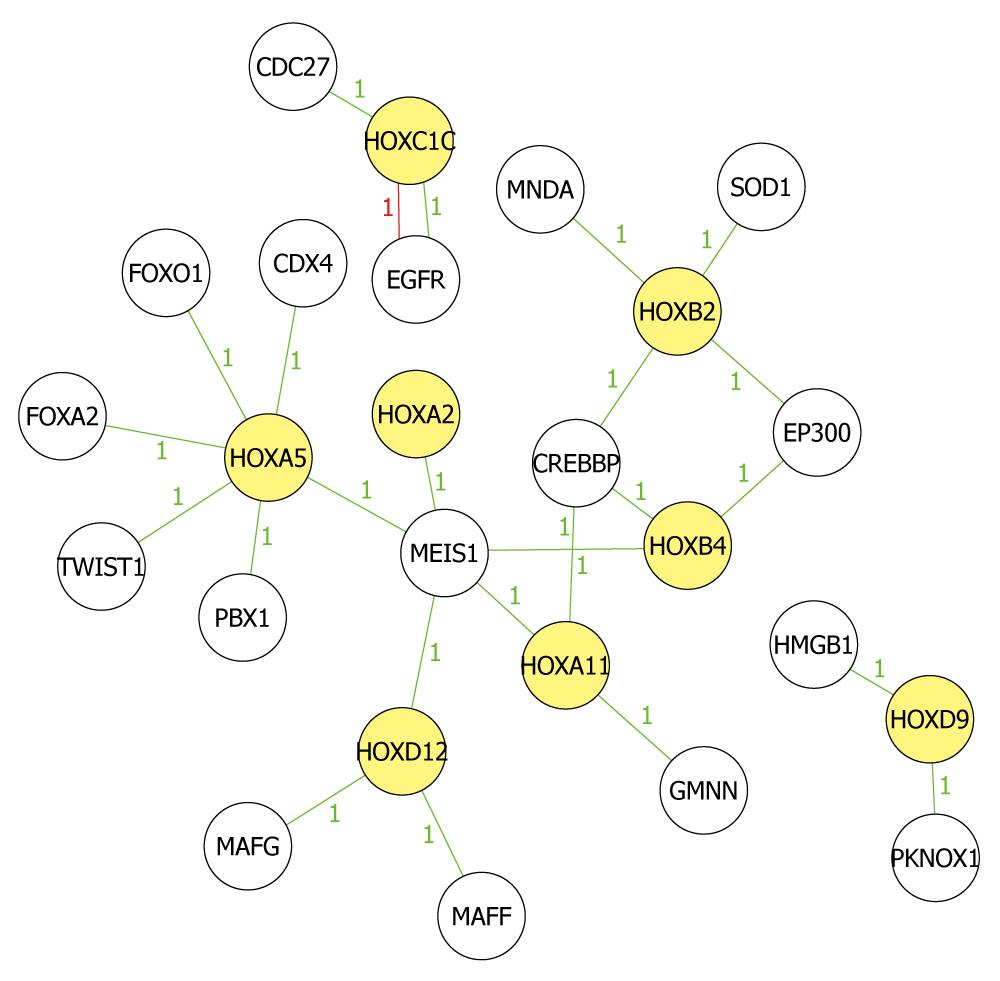
Figure 5 Network analysis of known biological relationships between HOX genes and their related genes.
Network analysis was performed and produced by Molecule Annotation System. Yellow icons indicate methylated Hox genes and colorless icons indicate methylated non-HOX genes, which have been demonstrated to be related to Hox genes in other studies. Green lines indicate high correlation and red lines indicate low correlation. All present hypermethylated status in the microarray results. Number between icons indicates the relationship mentioned in the reports.
- Citation: Shu Y, Wang B, Wang J, Wang JM, Zou SQ. Identification of methylation profile of HOX genes in extrahepatic cholangiocarcinoma. World J Gastroenterol 2011; 17(29): 3407-3419
- URL: https://www.wjgnet.com/1007-9327/full/v17/i29/3407.htm
- DOI: https://dx.doi.org/10.3748/wjg.v17.i29.3407


