Copyright
©2011 Baishideng Publishing Group Co.
World J Gastroenterol. Jul 21, 2011; 17(27): 3235-3241
Published online Jul 21, 2011. doi: 10.3748/wjg.v17.i27.3235
Published online Jul 21, 2011. doi: 10.3748/wjg.v17.i27.3235
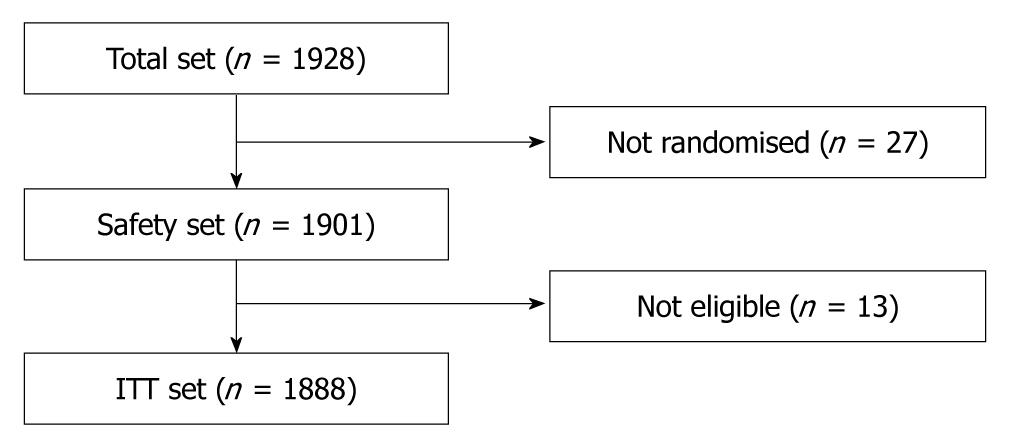
Figure 1 Flowchart of patient disposition.
n: Number of patients; ITT: Intention-to-treat.
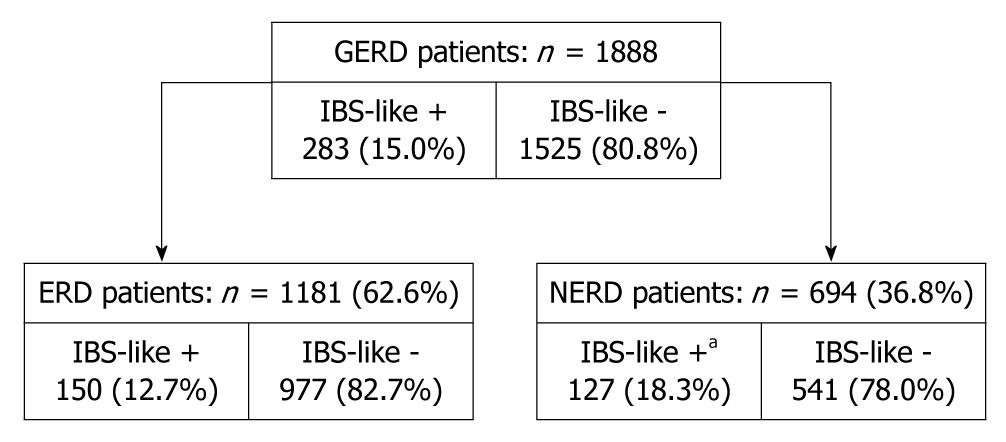
Figure 2 Subgroups of gastroesophageal reflux disease patients according to esophagitis and irritable bowel syndrome-like symptoms.
Percentages do not equal 100% due to missing values. aP = 0.0015, irritable bowel syndrome (IBS)-like +: patients with non-erosive reflux disease (NERD) vs patients with erosive (ERD). n: Number of patients; GERD: Gastroesophageal reflux disease.
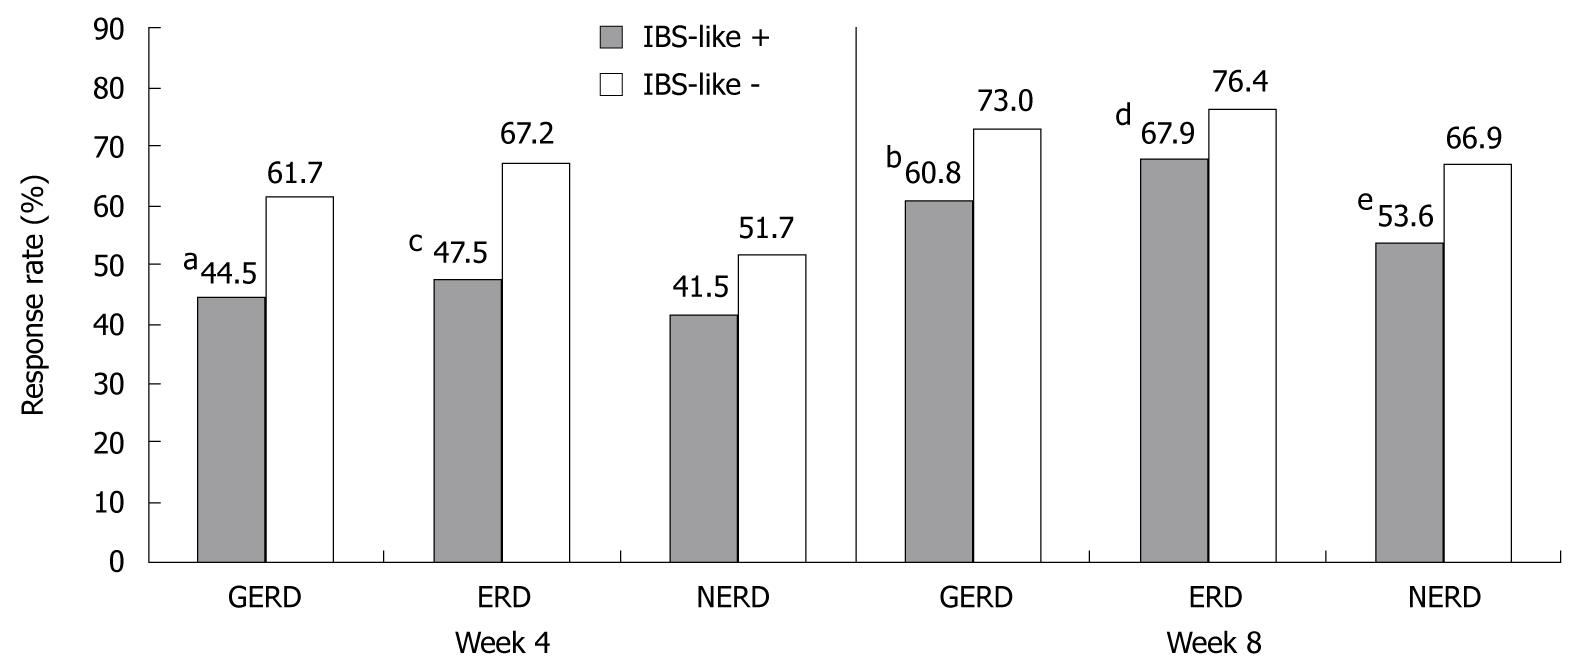
Figure 3 Response rates for gastroesophageal reflux disease/erosive/non-erosive reflux disease patients with or without irritable bowel syndrome-like symptoms after 4 and 8 wk of treatment with pantoprazole.
aP < 0.0001 irritable bowel syndrome (IBS)-like + vs IBS-like - in patients with gastroesophageal reflux disease (GERD) after 4 wk; bP < 0.0001 IBS-like + vs IBS-like - in patients with GERD after 8 wk, cP < 0.0001 IBS-like + vs IBS-like - in patients with erosive reflux disease (ERD) after 4 wk, dP = 0.0339 IBS-like + vs IBS-like - in patients with ERD after 8 wk, eP = 0.0088 IBS-like + vs IBS-like - in patients with non-erosive reflux disease (NERD) after 8 wk.
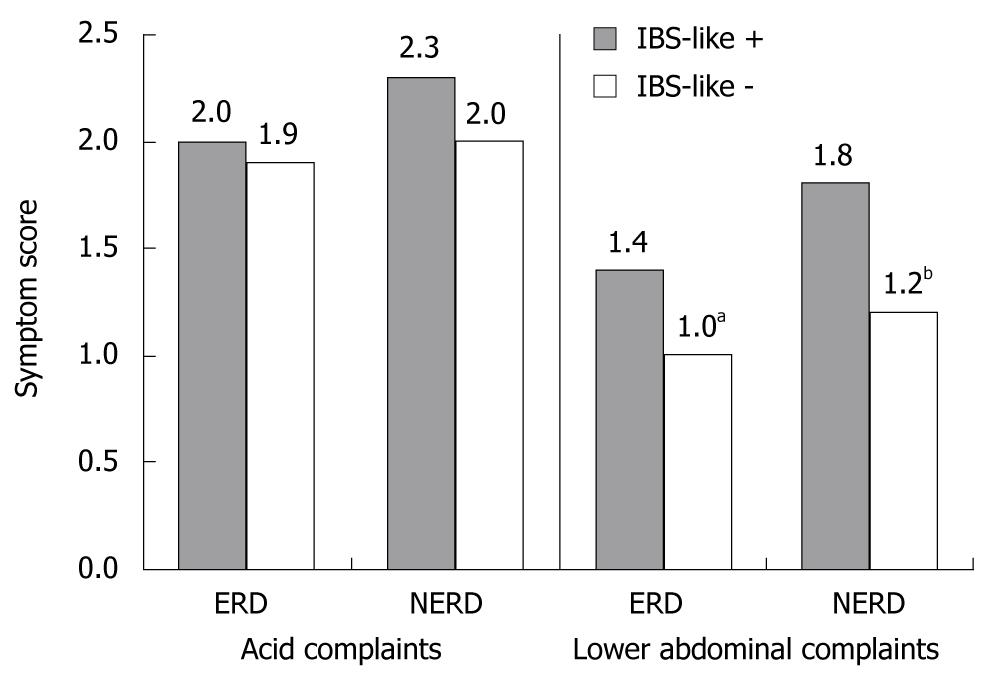
Figure 4 Symptom scores for “acid complaints” and “lower abdominal complaints” in erosive and non-erosive reflux disease patients with and without IBS-like symptoms at baseline.
aP < 0.0001 irritable bowel syndrome (IBS)-like + vs IBS-like - in patients with erosive reflux disease (ERD) at baseline, bP < 0.0001 IBS-like + vs IBS-like - in patients with non-erosive reflux disease (NERD) at baseline.
- Citation: Mönnikes H, Heading RC, Schmitt H, Doerfler H. Influence of irritable bowel syndrome on treatment outcome in gastroesophageal reflux disease. World J Gastroenterol 2011; 17(27): 3235-3241
- URL: https://www.wjgnet.com/1007-9327/full/v17/i27/3235.htm
- DOI: https://dx.doi.org/10.3748/wjg.v17.i27.3235


