Copyright
©2011 Baishideng Publishing Group Co.
World J Gastroenterol. Jul 7, 2011; 17(25): 2992-3001
Published online Jul 7, 2011. doi: 10.3748/wjg.v17.i25.2992
Published online Jul 7, 2011. doi: 10.3748/wjg.v17.i25.2992
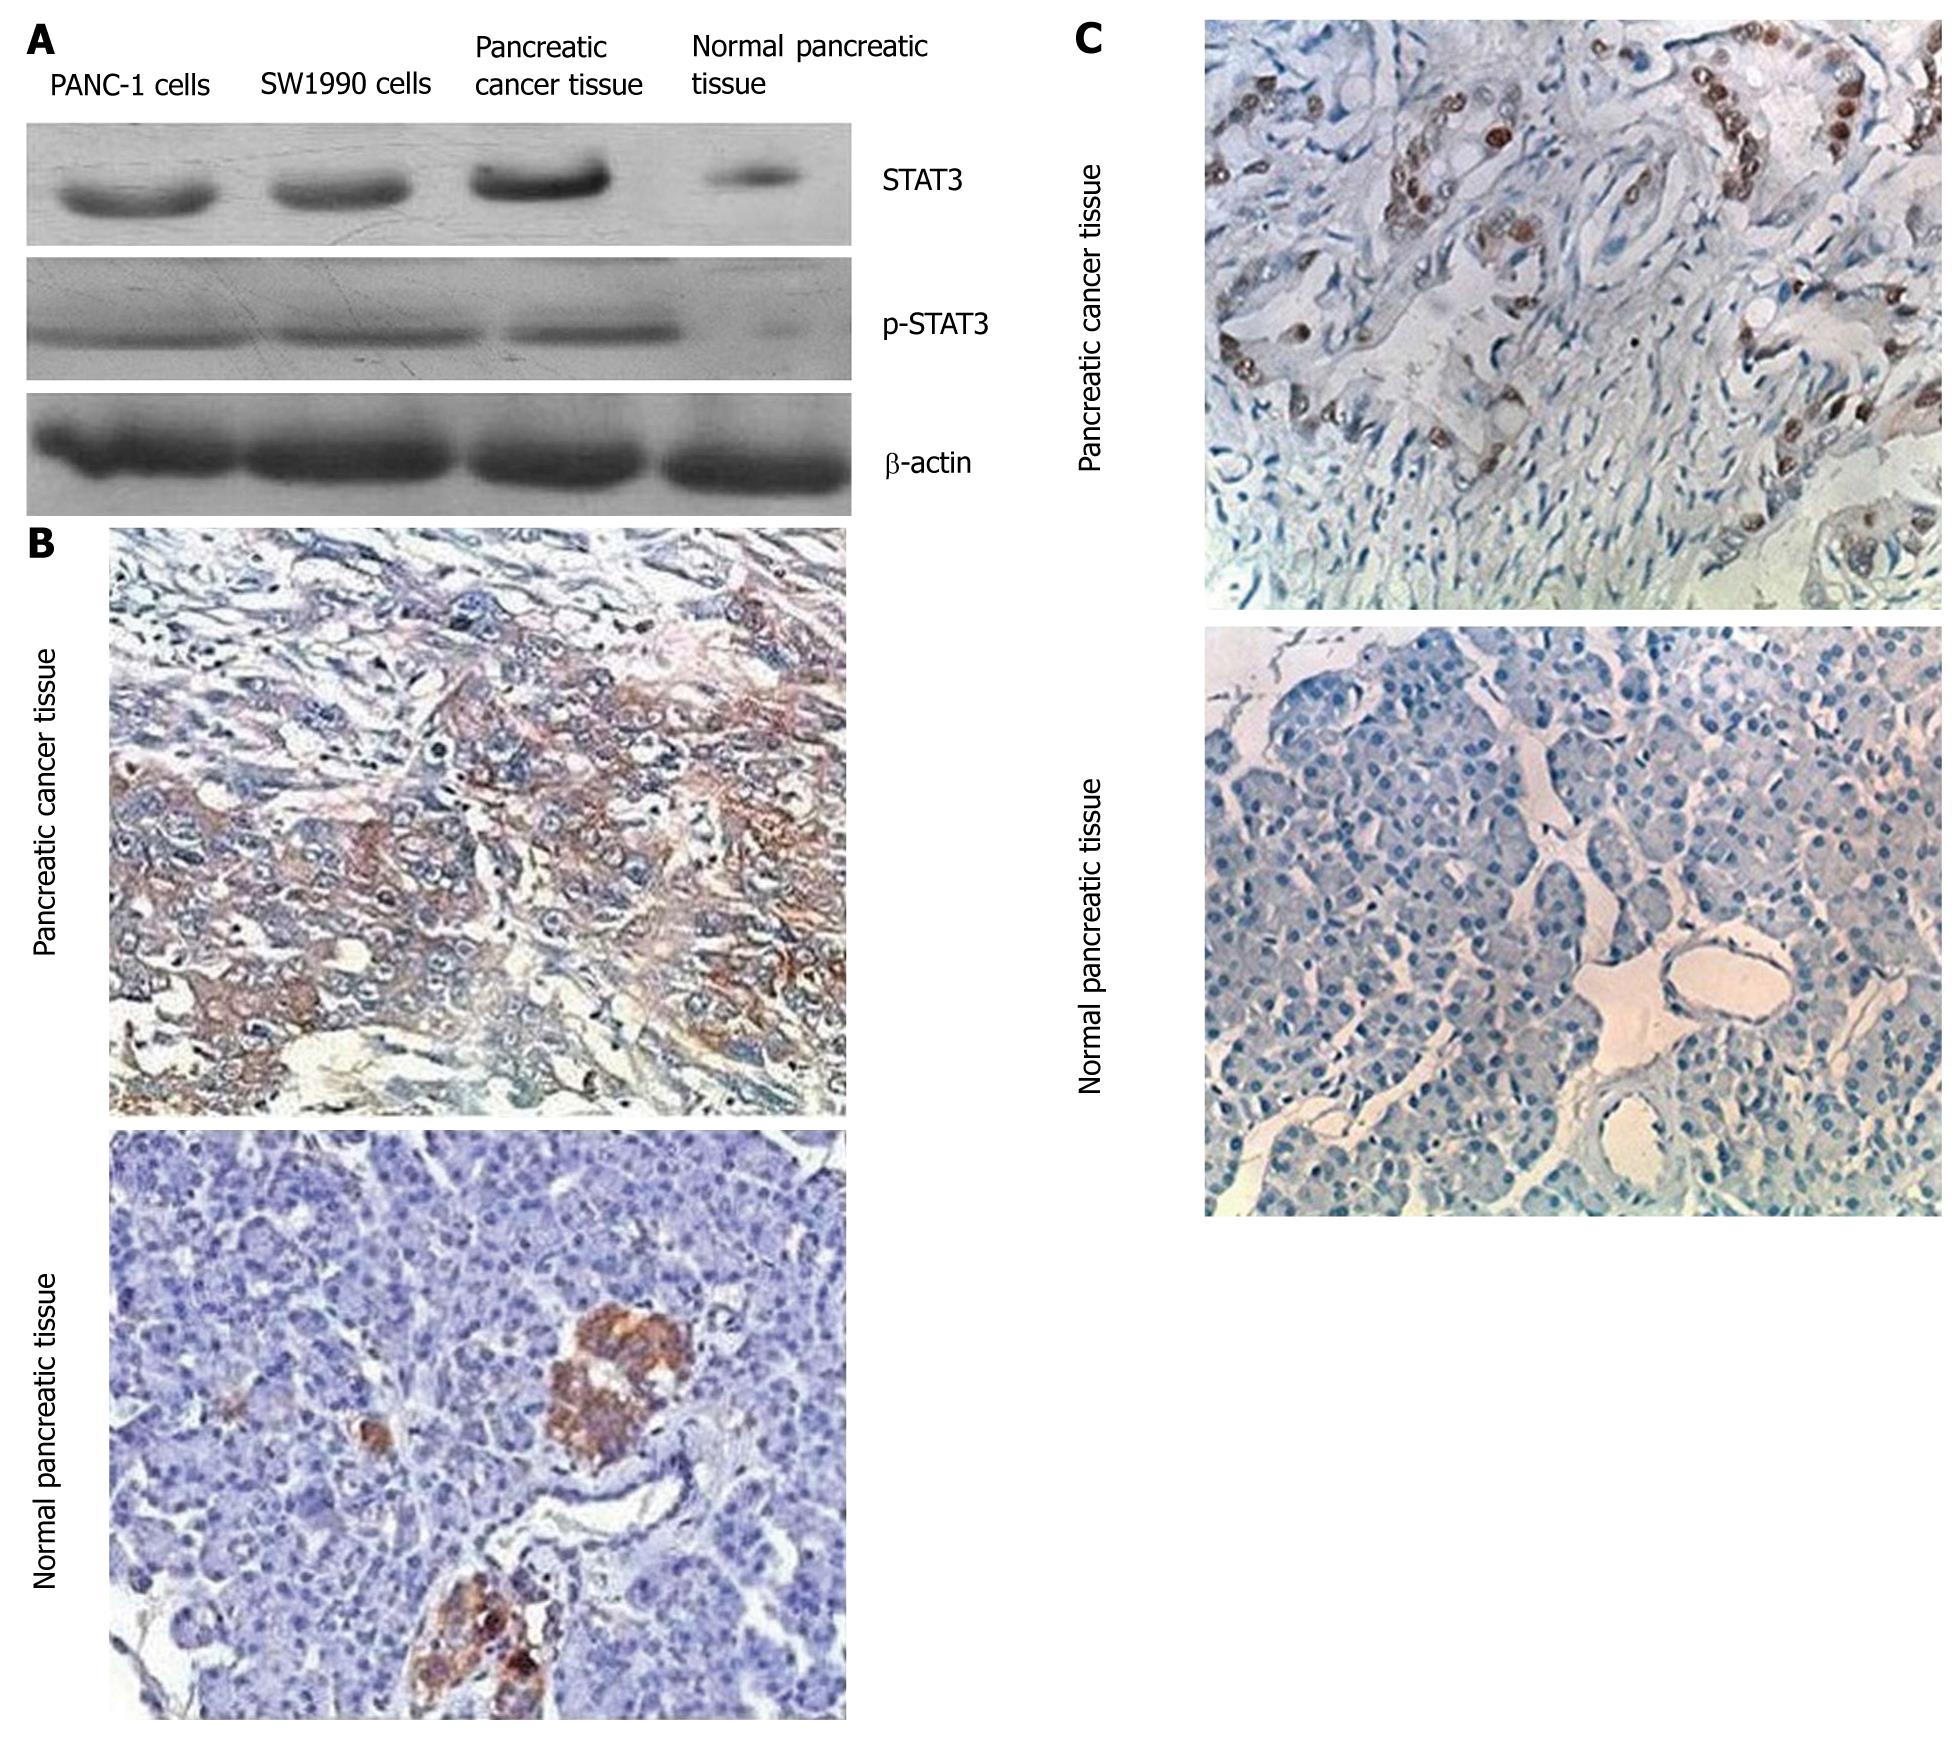
Figure 1 Signal transduction and activation of transcription 3 expression in human pancreatic cancer cells.
A: Western blotting analysis of STAT3 and p-STAT3 expression in PANC-1, SW1990, pancreatic cancer, and normal pancreatic tissue with 100 μg total protein for each sample; B: Immunohistochemical analysis of STAT3 expression: pancreatic cancer tissue shows a high-density staining for STAT3 while normal pancreatic tissues show a low-density staining; C: Immunohistochemical analysis of p-STAT3 expression: pancreatic cancer tissue shows a high-density staining for p-STAT3 while normal pancreatic tissues does not show any staining. STAT3: Signal transduction and activation of transcription 3.
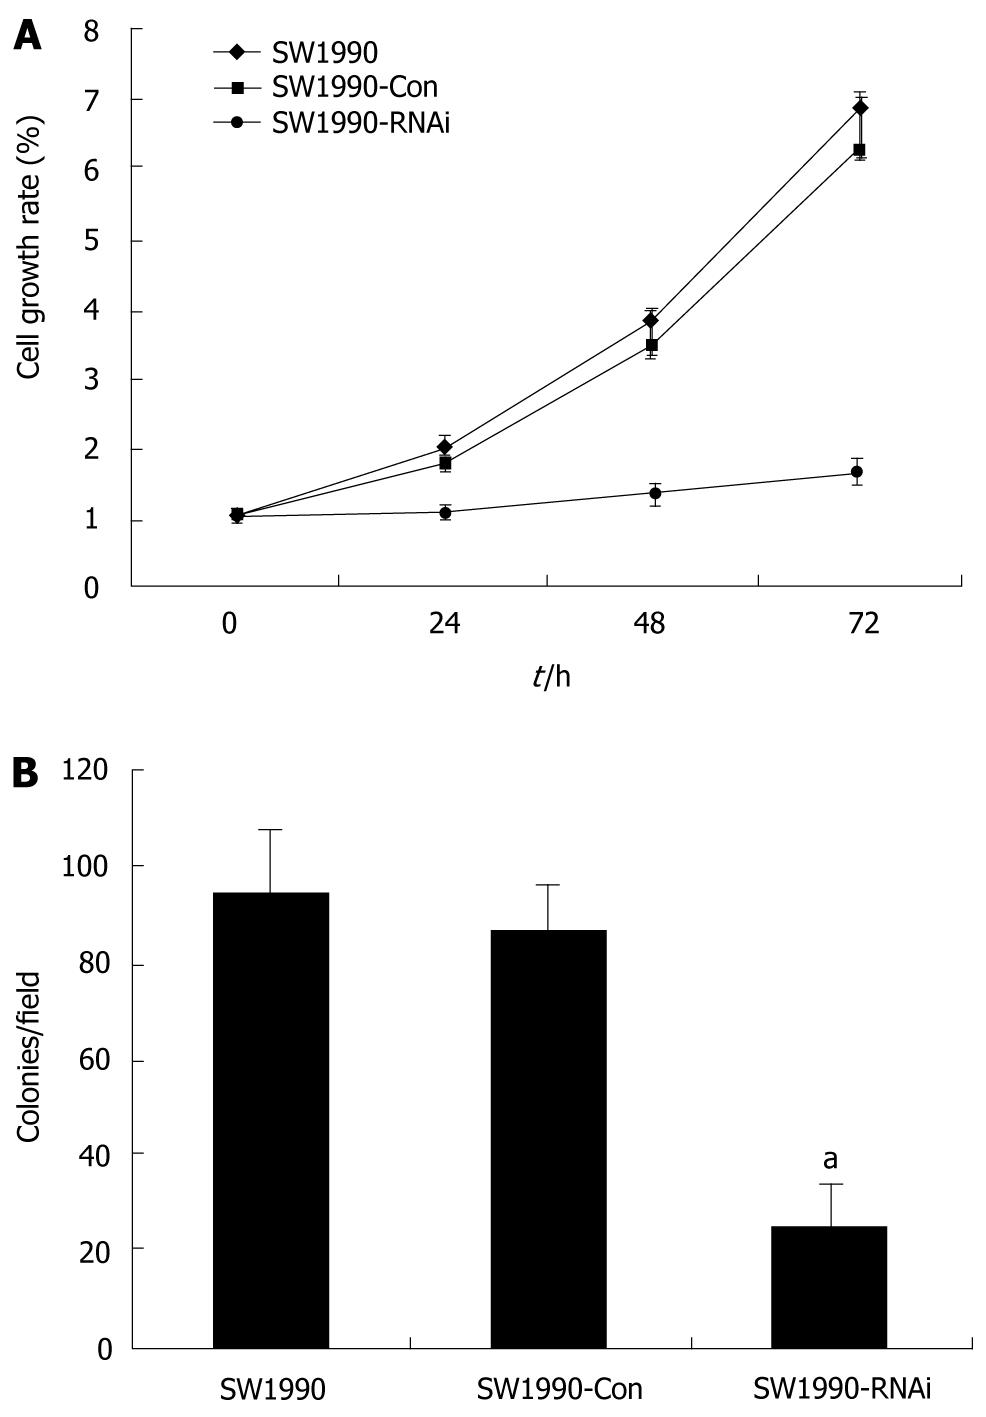
Figure 2 Effects of silence of signal transduction and activation of transcription 3 gene on cell proliferation and anchorage-independent growth of pancreatic cancer cells.
A: Cell growth curve of pancreatic cancer cells. SW1990 cells and stably-transfected cells (SW1990-Con and SW1990-RNAi) were subjected to MTT assay as described in materials and methods. Cell proliferation of SW1990-RNAi cells was significantly reduced compared with parental SW1990 and SW1990-Con cells; B: Cell colony formation in soft agar of pancreatic cancer cells. SW1990 cells and stably-transfected cells (SW1990-Con and SW1990-RNAi) were subjected to colony formation assay as described in materials and methods. The anchorage-independent growth ability of SW1990-RNAi cells was significantly reduced compared with parental SW1990 and SW1990-Con cells. Columns: mean (n = 3); Bars: SD. aP < 0.05 vs control. SW1990-Con: SW1990 pRNAT-Con transfectants; SW1990-RNAi: SW1990 STAT3-RNAi transfectants.
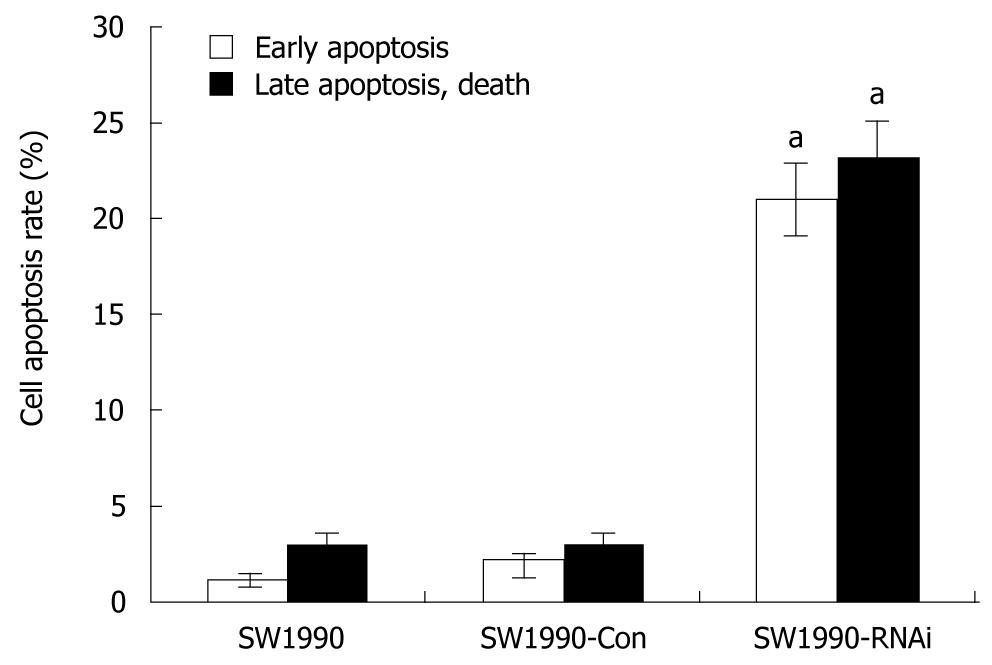
Figure 3 Effects of silence of signal transduction and activation of transcription 3 gene on apoptosis of pancreatic cancer cells.
SW1990 cells and stably-transfected cells (SW1990-Con and SW1990-RNAi) were collected to analyze the cell apoptosis with flow cytometry. More apoptotic cells were detected in SW1990-RNAi cells than in parental SW1990 and SW1990-Con cells. Columns: mean (n = 3); bars: SD. aP < 0.05 vs control. SW1990-Con: SW1990 pRNAT-Con transfectants; SW1990-RNAi: SW1990 STAT3-RNAi transfectants.
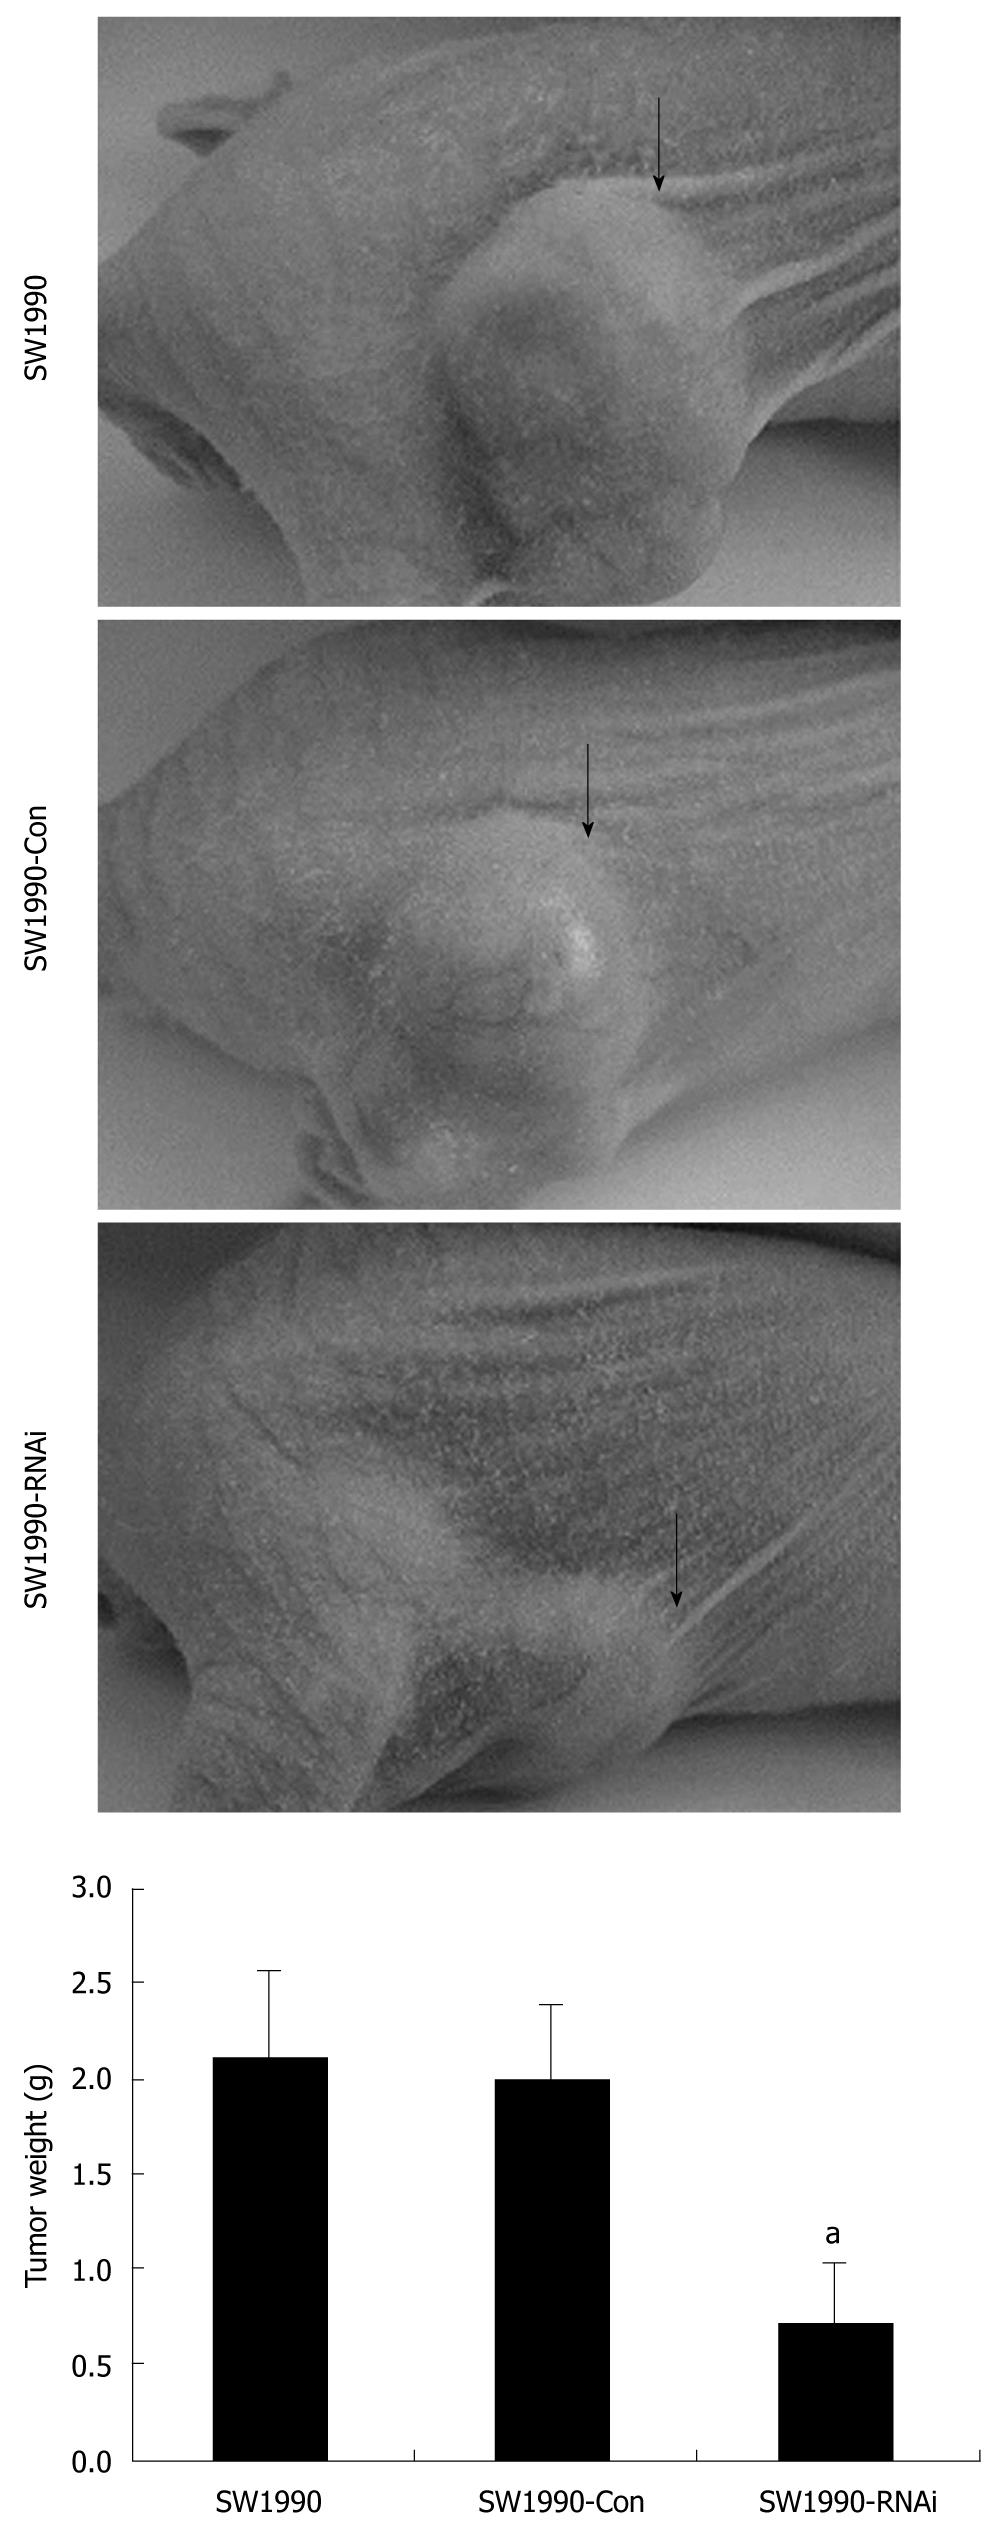
Figure 4 Effects of silence of signal transduction and activation of transcription 3 gene on tumorigenicity in vivo.
In vivo assay was done as described in materials and methods. Six weeks after injection, tumors were harvested and analyzed. Tumors from pRNAT-STAT3-siRNA-II–infected SW1990 cells were significantly smaller than those of control mice. Columns: mean (n = 6); Bars: SD. aP < 0.05 vs control. SW1990-Con: SW1990 pRNAT-Con transfectants; SW1990-RNAi: SW1990 STAT3-RNAi transfectants.
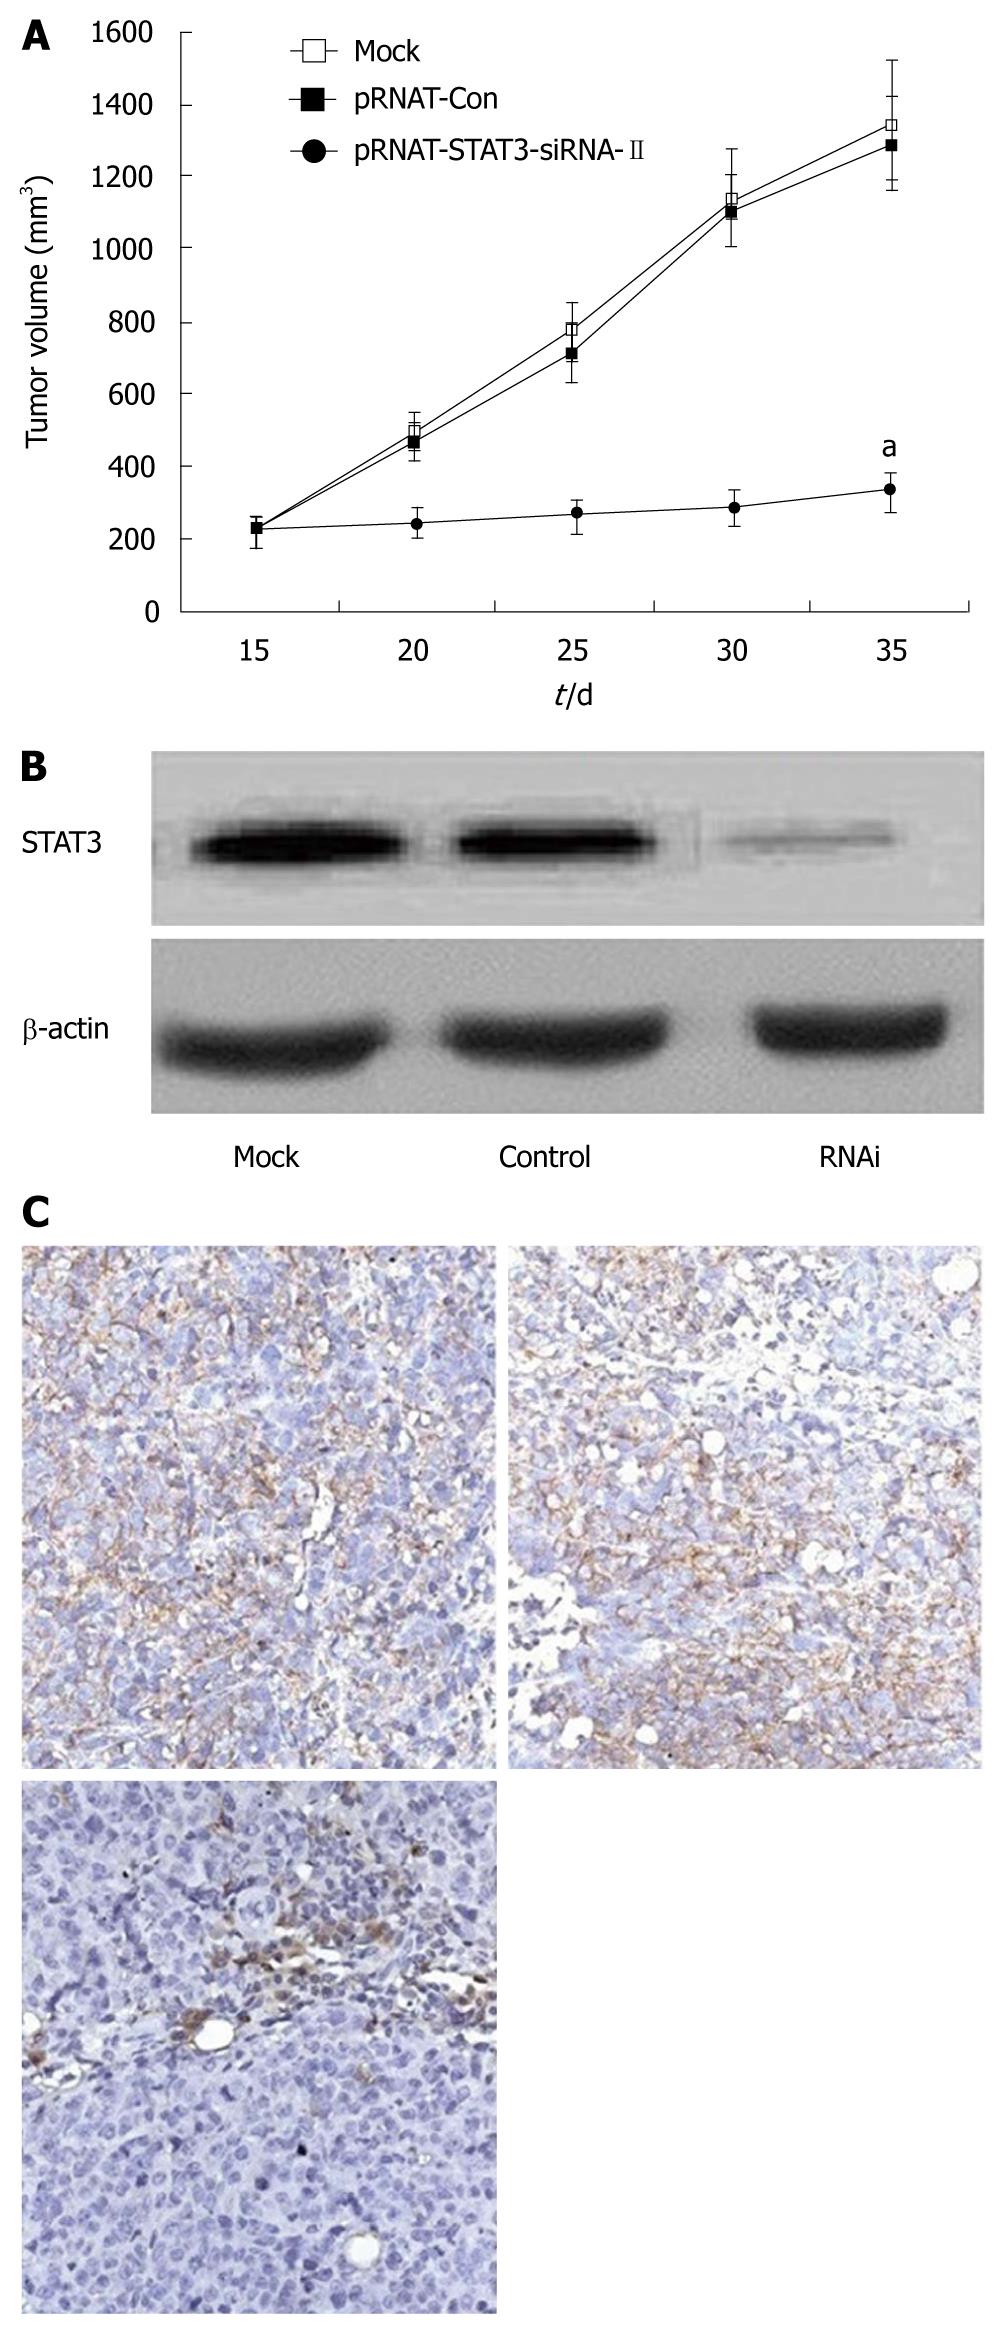
Figure 5 Effects of silence of signal transduction and activation of transcription 3 gene on tumor growth in vivo.
A: Tumor growth curve after injection with mock, pRNAT-Con, and pRNAT-STAT3-siRNA-II cells. Intratumoral electroinjection of pRNAT-STAT3-siRNA-II resulted in significant inhibition of tumor growth; Points: mean (n = 6); bars: SD. aP < 0.05 vs control; B: STAT3 expression of the tumors after injection with mock, pRNAT-Con, and pRNAT-STAT3-siRNA-IIcells was analyzed by Western blotting. In pRNAT-STAT3-siRNA-II–treated tumors, STAT3 expression was significantly reduced. β-actin expression served as a control for equivalent protein loading; C: Tumor sections obtained from mock-, pRNAT-Con-, and pRNAT-STAT3-siRNA-II cells –injected tumors were immunostained using anti-STAT3 antibody. In pRNAT-STAT3-siRNA-II–treated tumors, STAT3 expression was significantly reduced.
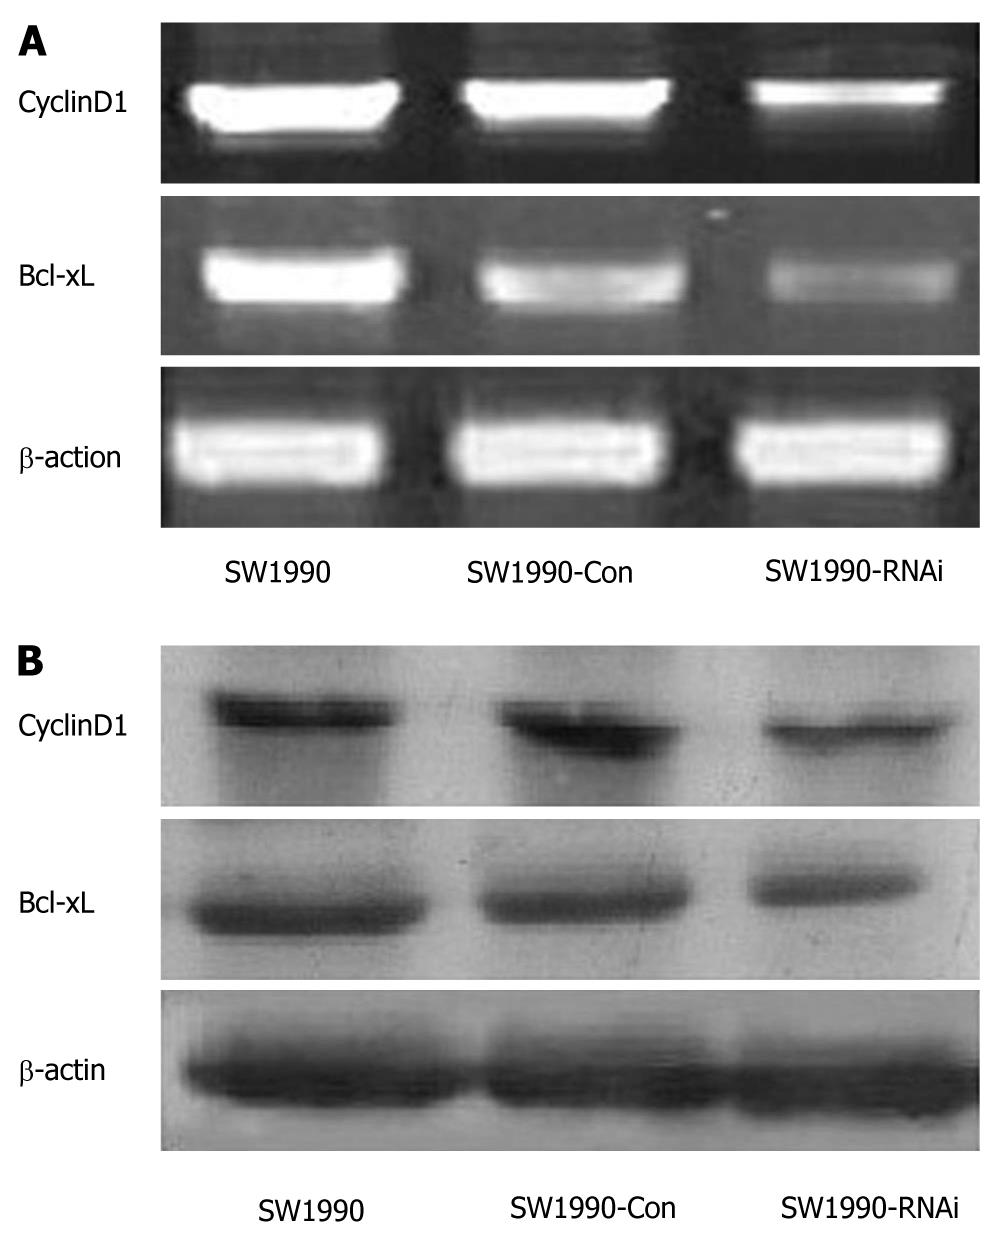
Figure 6 Effects of silence of signal transduction and activation of transcription 3 gene on the expression of CyclinD1 and Bcl-xL.
A: Reverse transcription polymerase chain reaction analysis. The RNA samples (2 μg in each) extracted from SW1990 cells, SW1990 cells transfected with a control vector (SW1990-Con), and SW1990 cells transfected with STAT3-RNAi (SW1990-RNAi) were subjected to RT-PCR for CyclinD1, Bcl-xL and β-actin mRNAs. RT-PCR for β-actin was performed in parallel to show an equal amount of total RNA in the sample; B: Western blotting analysis. Whole protein extracts (100 μg in each) were prepared from SW1990 cells, SW1990-Con, and SW1990-RNAi. The expression of CyclinD1 protein was determined by Western blotting with an anti-CyclinD1 antibody. The expression of Bcl-xL protein was determined by Western blotting analysis with an anti-Bcl-xL antibody. The β-actin expression levels were determined as a control for equivalent protein loading. Results shown represent one of the three experiments.
- Citation: Huang C, Yang G, Jiang T, Cao J, Huang KJ, Qiu ZJ. Down-regulation of STAT3 expression by vector-based small interfering RNA inhibits pancreatic cancer growth. World J Gastroenterol 2011; 17(25): 2992-3001
- URL: https://www.wjgnet.com/1007-9327/full/v17/i25/2992.htm
- DOI: https://dx.doi.org/10.3748/wjg.v17.i25.2992


