Copyright
©2011 Baishideng Publishing Group Co.
World J Gastroenterol. May 7, 2011; 17(17): 2229-2235
Published online May 7, 2011. doi: 10.3748/wjg.v17.i17.2229
Published online May 7, 2011. doi: 10.3748/wjg.v17.i17.2229
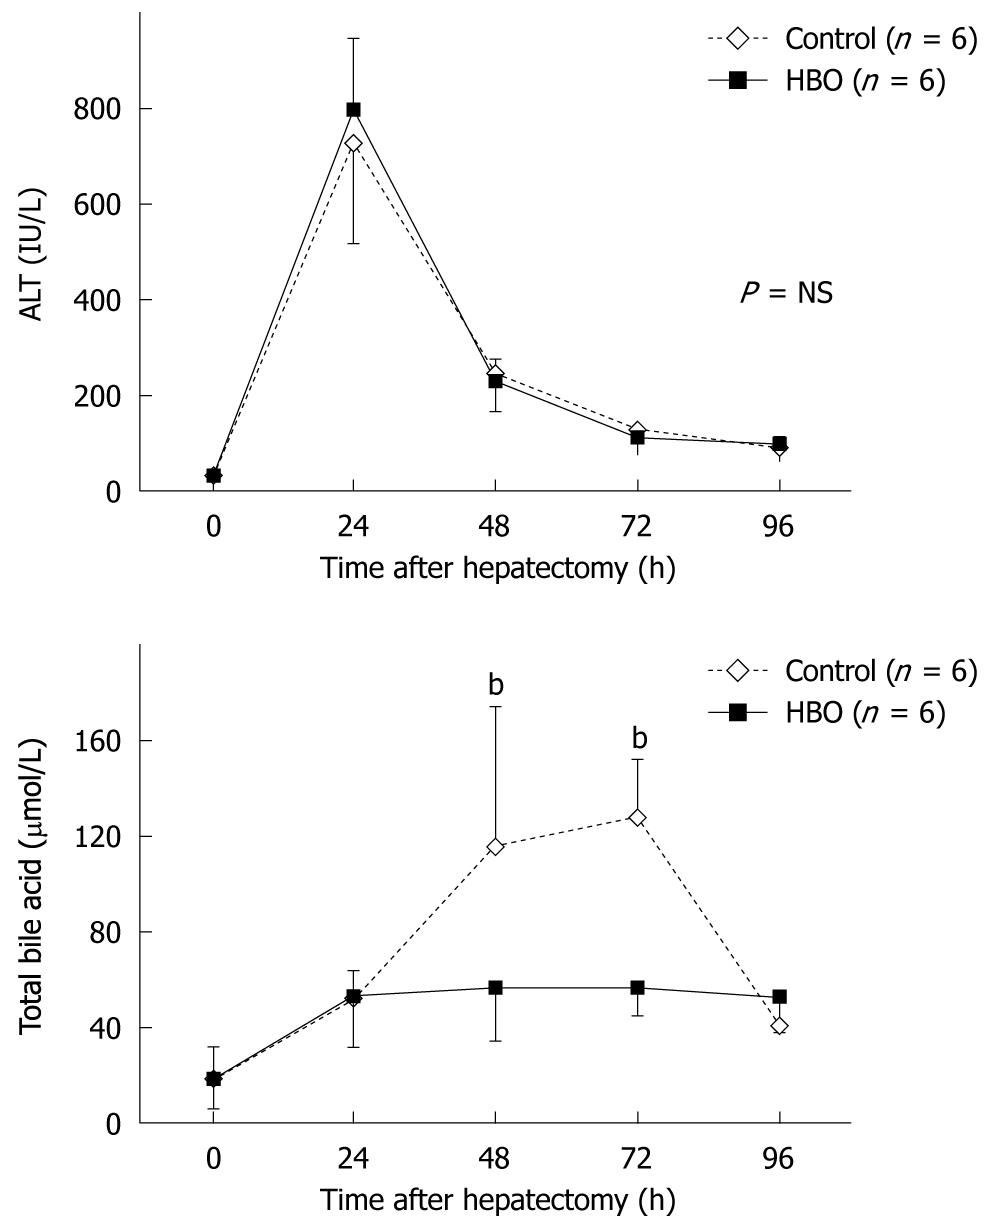
Figure 1 Serum parameters after hepatectomy.
No significant difference was observed in the postoperative serum alanine aminotransferase (ALT) levels between the 2 groups. Total bile acid levels at 48 and 72 h after hepatectomy were significantly lower in the hyperbaric oxygenation (HBO) group than in the control group. Results are expressed as mean ± SD of n = 6 for each period in each group. NS: No significant. bP < 0.01.
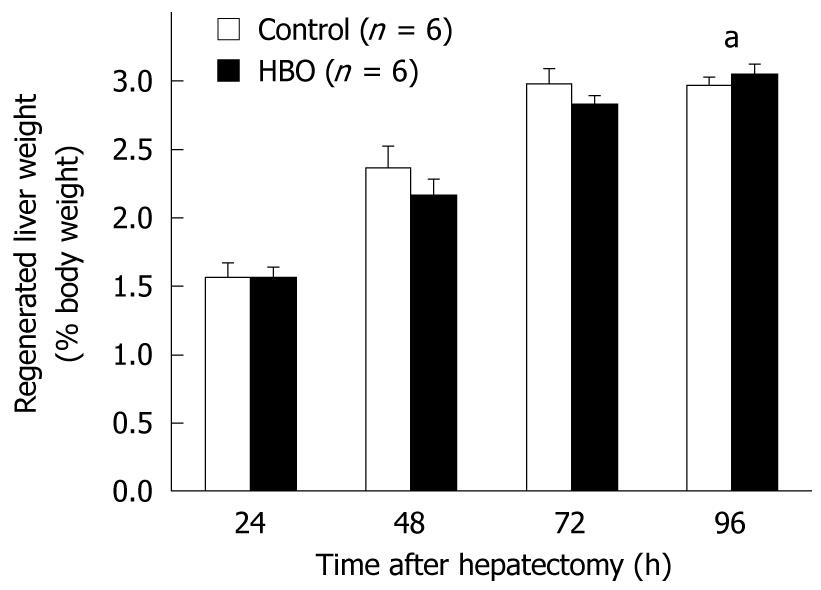
Figure 2 Regenerated liver weight /(% body weight).
In both groups, the percentage weight of the regenerated liver increased daily after hepatectomy. At 96 h after hepatectomy, the percentage weight was higher in the hyperbaric oxygenation (HBO) group than in the control group. Results are expressed as mean ± SD of n = 6 for each period in each group. aP < 0.05.
Figure 3 Percentage of proliferating cell nuclear antigen-positive cells in both groups at 24, 48, 72 and 96 h after hepatectomy.
A: The percentage of proliferating cell nuclear antigen (PCNA)-positive hepatocytes was higher at 48 and 72 h and lower at 24 h in the hyperbaric oxygenation (HBO) group than in the control group. The percentage of PCNA-positive biliary ductal cells in the HBO group was higher at 48 h compared with the control group; B: The proliferation of biliary ductal cells was increased in the HBO group, with an early peak at 48 h. Results are expressed as mean ± SD of n = 6 for each period in each group. aP < 0.05, bP < 0.01.
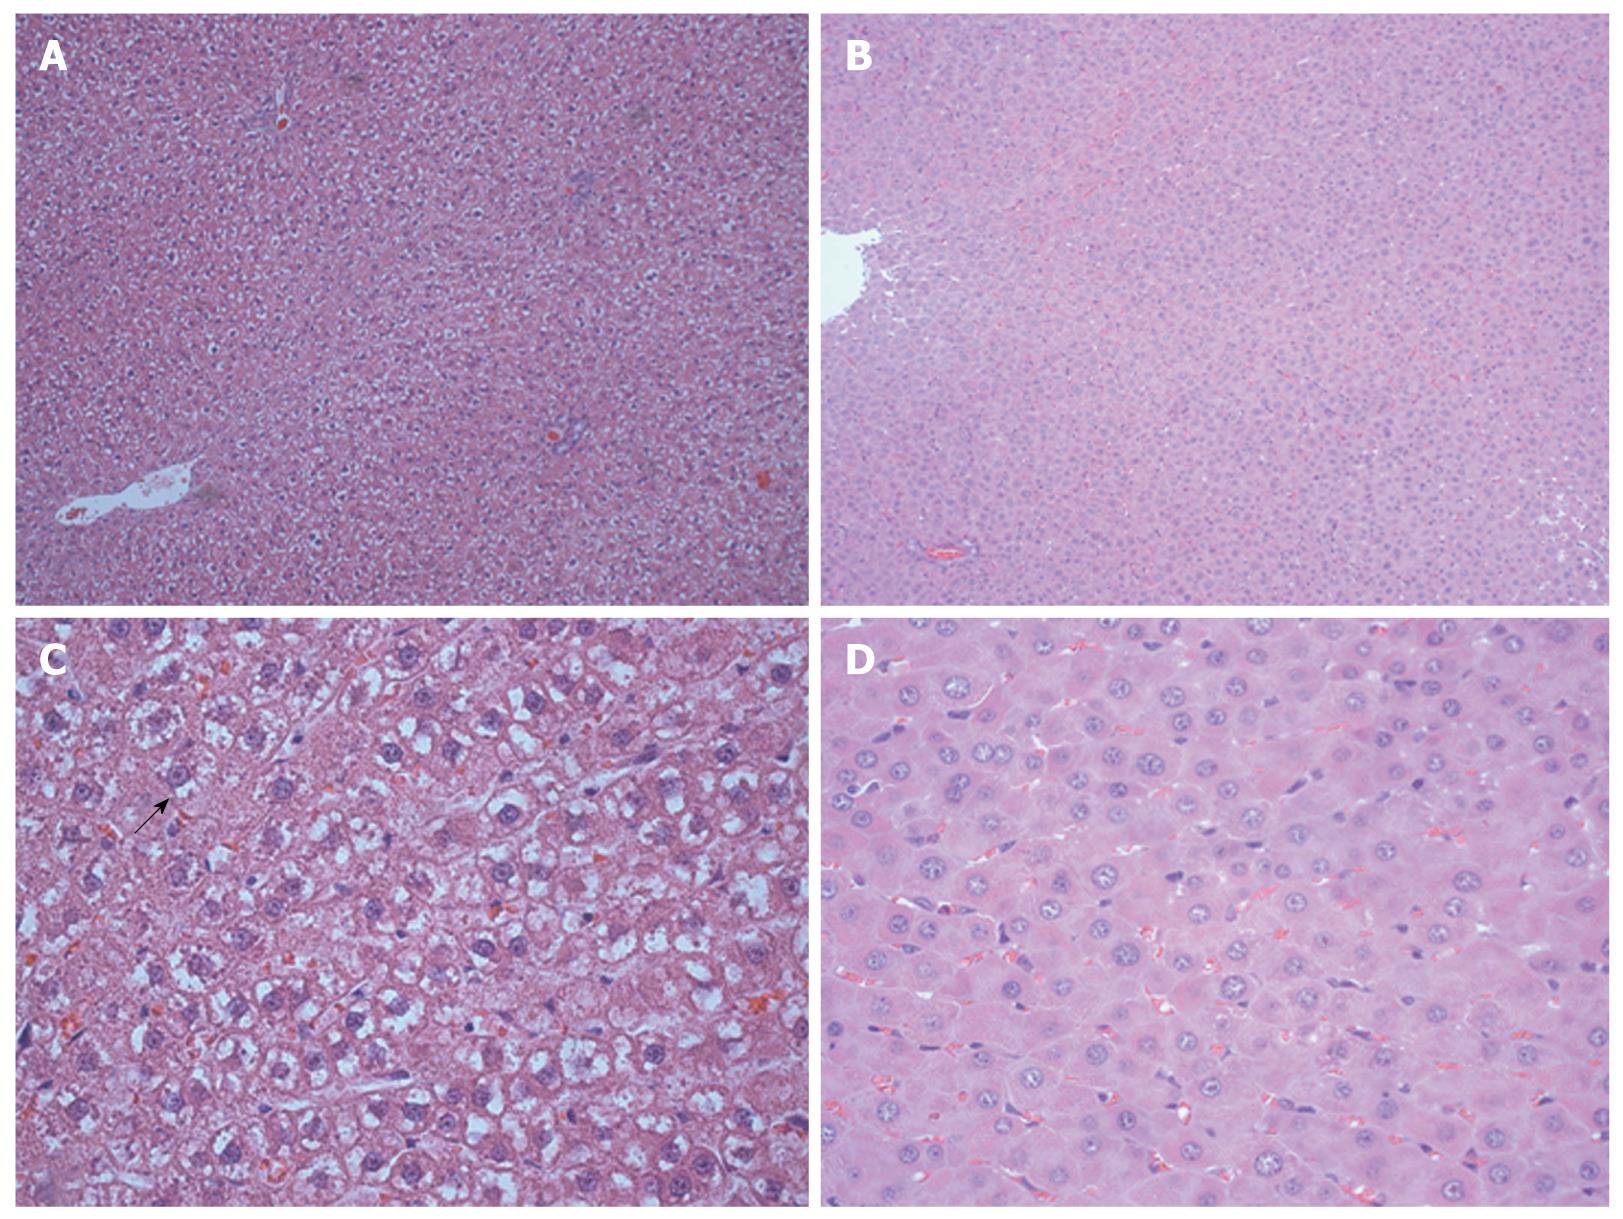
Figure 4 Hematoxylin and eosin staining of the liver slices at 96 h after hepatectomy.
Control group (A: 100 × magnification, C: 400 ×). Hyperbaric oxygenation (HBO) group (B: 100 ×, D: 400 ×). In the control group, the regenerating livers were edematous and showed ballooned hepatocytes (C, arrow). In addition, the number of hepatocytes per high power field was lower in the control group than in the HBO group.
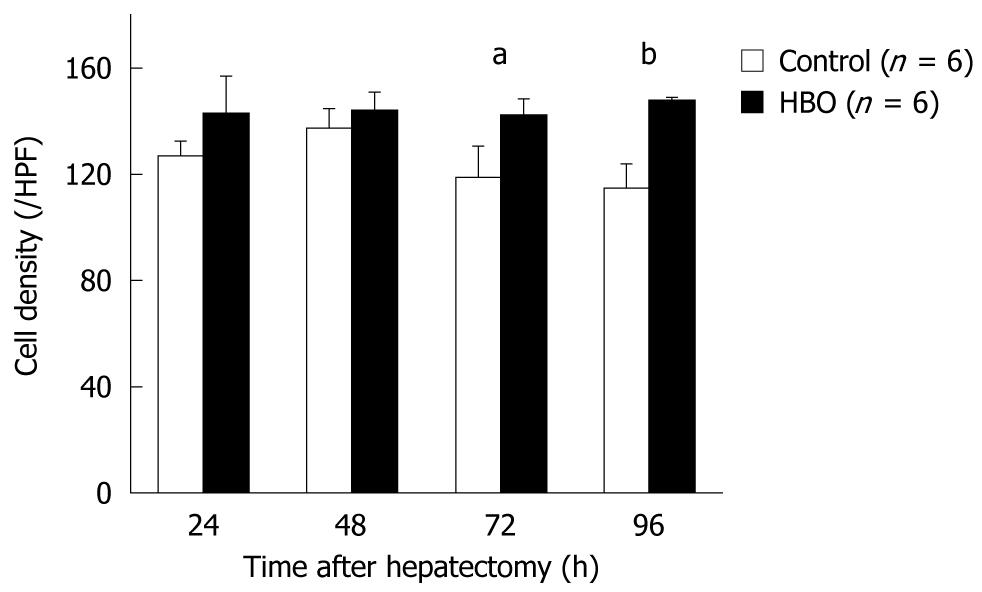
Figure 5 Cell density calculated as the number of hepatocytes per high power field.
The cell density was higher in the hyperbaric oxygenation (HBO) group than in the control group at 72 and 96 h after hepatectomy. Results are expressed as mean ± SD of n = 6 for each period in each group. aP < 0.05, bP < 0.01.
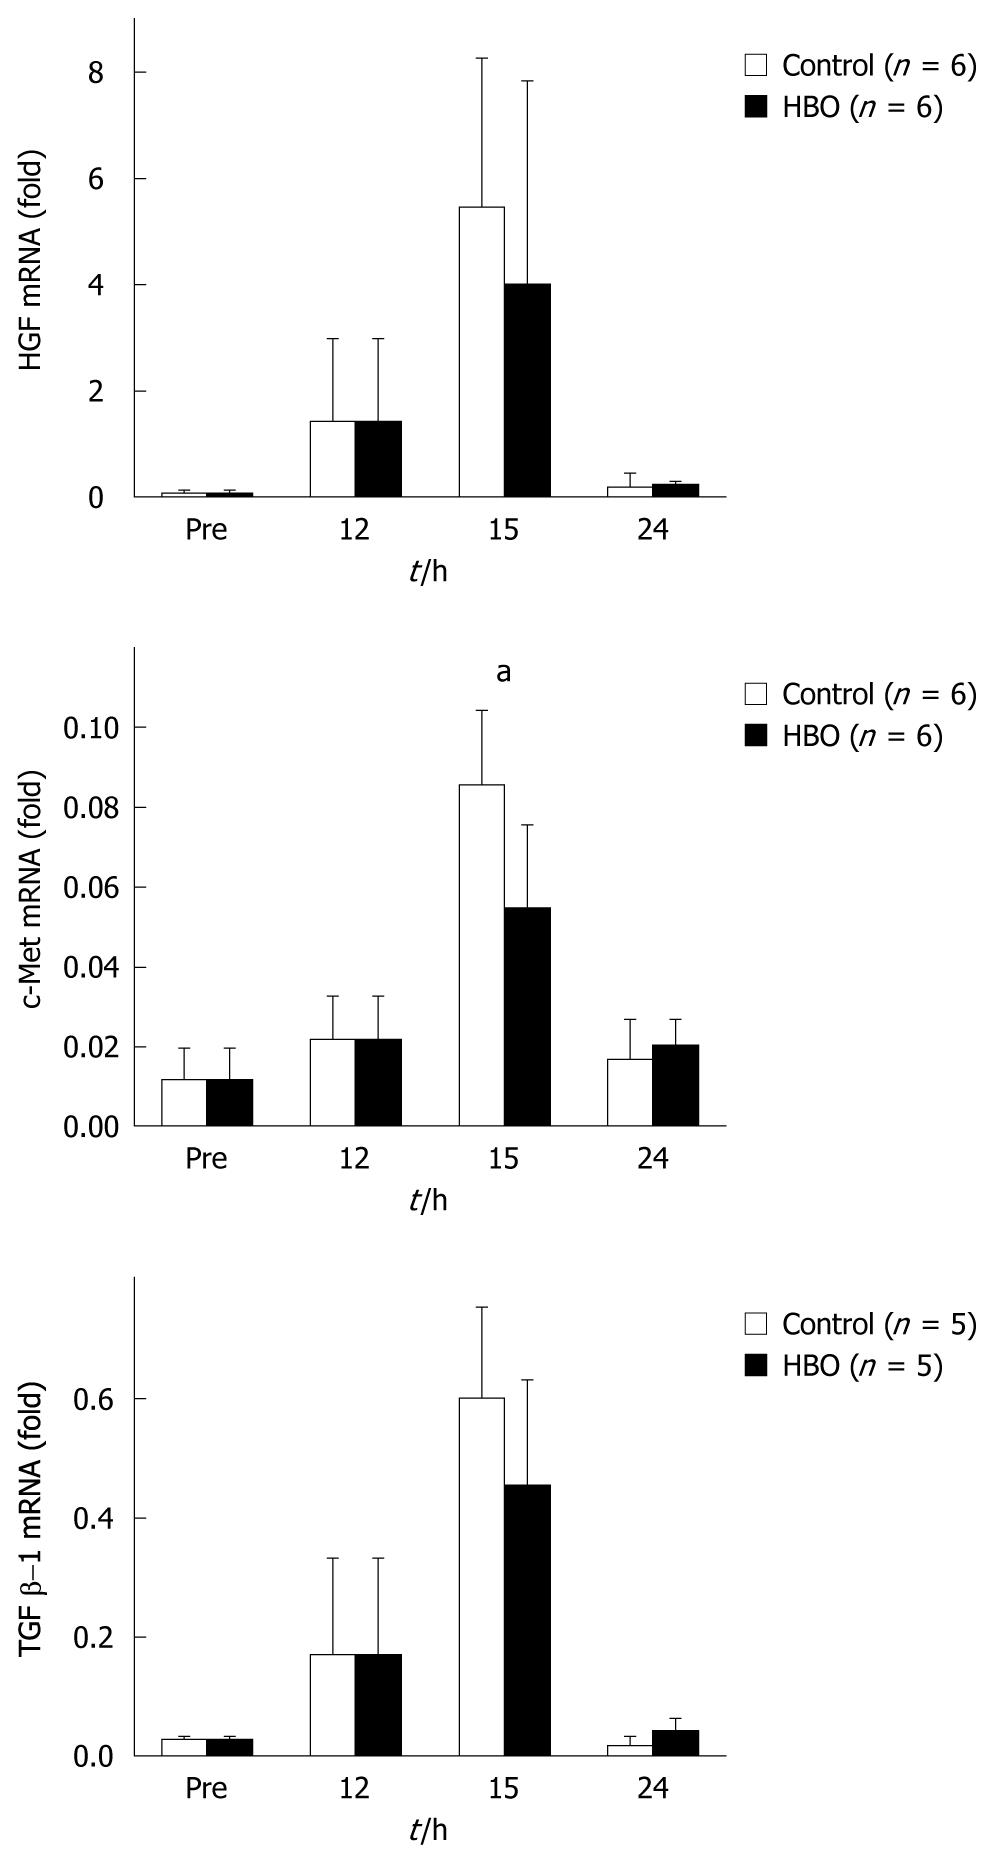
Figure 6 Expressions of hepatocyte growth factor, c-Met and transforming growth factor β-1 mRNA in the liver tissues determined at various time points.
Results are expressed as mean ± SD. Hepatocyte growth factor (HGF) and c-Met: n = 6 for each period in each group, transforming growth factor (TGF) β-1: n = 5 for each period in each group. aP < 0.05.
- Citation: Idetsu A, Suehiro T, Okada K, Shimura T, Kuwano H. Hyperbaric oxygenation promotes regeneration of biliary cells and improves cholestasis in rats. World J Gastroenterol 2011; 17(17): 2229-2235
- URL: https://www.wjgnet.com/1007-9327/full/v17/i17/2229.htm
- DOI: https://dx.doi.org/10.3748/wjg.v17.i17.2229


