Copyright
©2011 Baishideng Publishing Group Co.
World J Gastroenterol. Apr 28, 2011; 17(16): 2155-2158
Published online Apr 28, 2011. doi: 10.3748/wjg.v17.i16.2155
Published online Apr 28, 2011. doi: 10.3748/wjg.v17.i16.2155
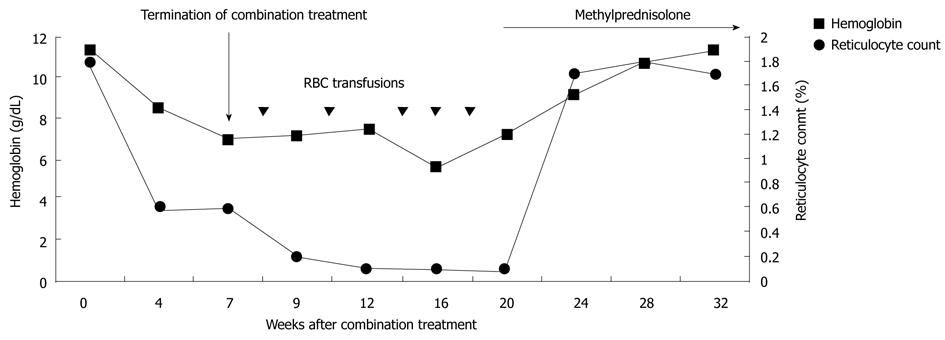
Figure 1 Hemoglobin level and reticulocyte count over time.
RBC: Red blood cells.
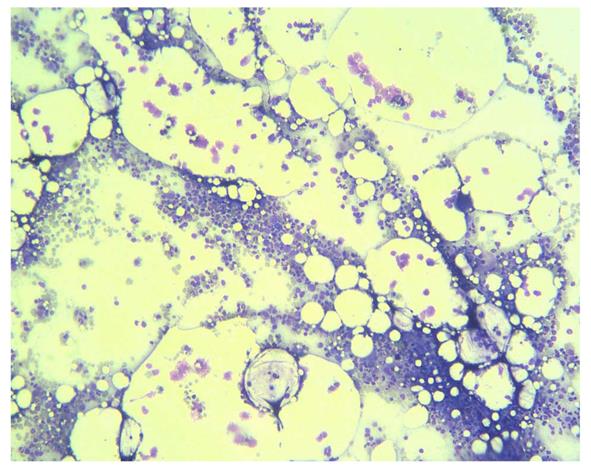
Figure 2 Photomicrograph of bone marrow biopsy showing overall hypocellularity of 10% (HE, x 40).
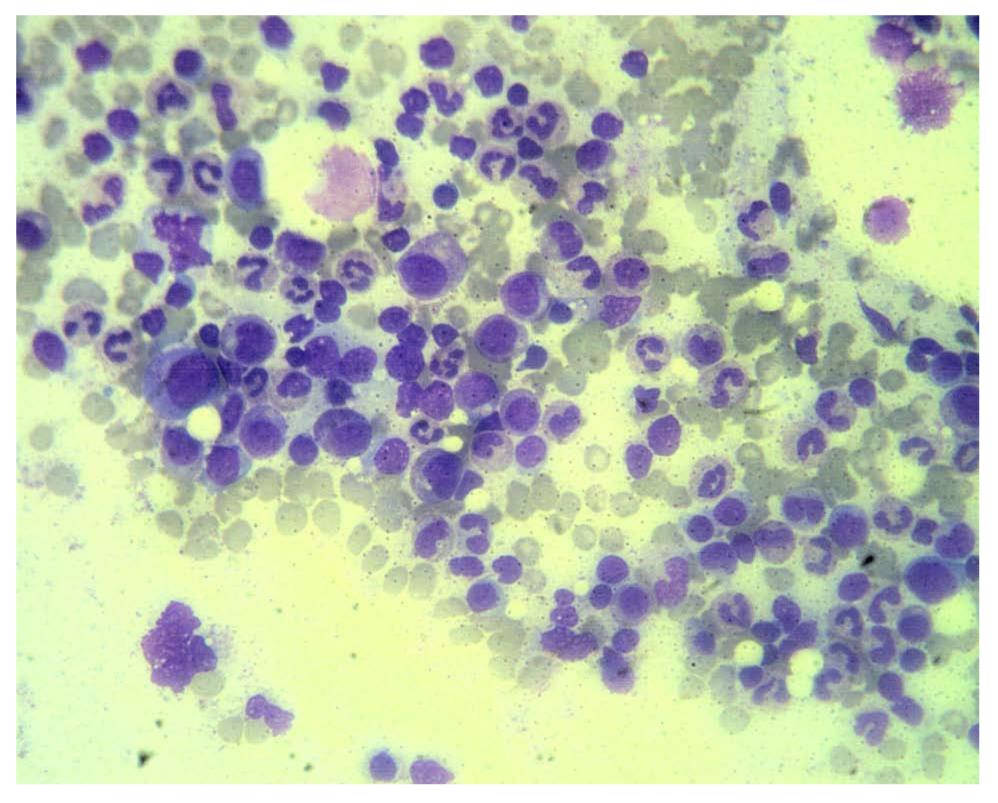
Figure 3 Photomicrograph of higher magnification showing normal maturation of myeloid precursors and absence of erythroid precursors in this field (HE, x 100).
- Citation: Chang CS, Yan SL, Lin HY, Yu FL, Tsai CY. Pure red cell aplasia caused by pegylated interferon-α-2a plus ribavirin in the treatment of chronic hepatitis C. World J Gastroenterol 2011; 17(16): 2155-2158
- URL: https://www.wjgnet.com/1007-9327/full/v17/i16/2155.htm
- DOI: https://dx.doi.org/10.3748/wjg.v17.i16.2155


