Copyright
©2011 Baishideng Publishing Group Co.
World J Gastroenterol. Mar 21, 2011; 17(11): 1427-1433
Published online Mar 21, 2011. doi: 10.3748/wjg.v17.i11.1427
Published online Mar 21, 2011. doi: 10.3748/wjg.v17.i11.1427
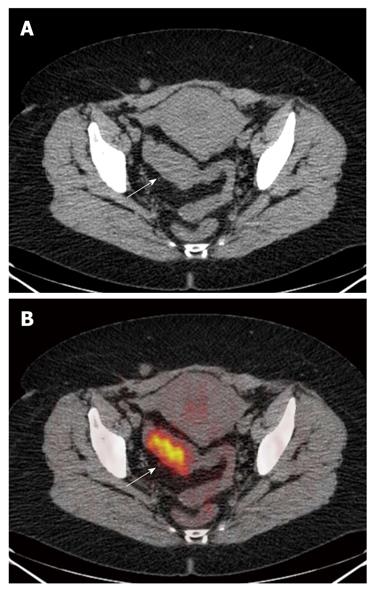
Figure 1 The computed tomography (A) and fused positron emission tomography/computed tomography (B) images.
A: Neoplastic thickening of sigmoid colon walls, which show regular profiles with normal appearance of perilesional fat (arrow); B: Uptake of 18-FDG (arrow) (SUVmax 11) in the absence of extra-parietal radio-tracer uptake. The lesion was correctly classified as ≤ T2.
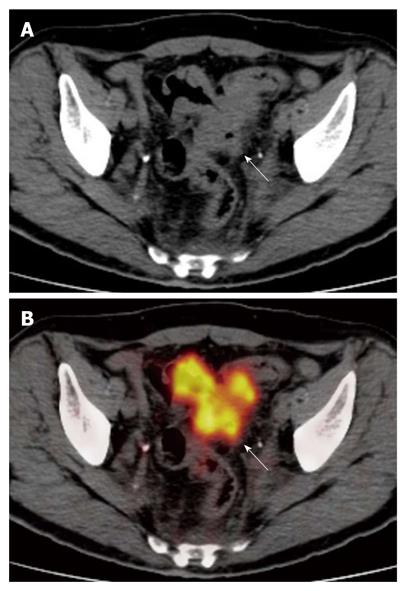
Figure 2 The computed tomography (A) and fused positron emission tomography/computed tomography (B) images show diffuse and irregular neoplastic thickening of sigmoid colon walls, which show rounded advancing margins with intense radiotracer uptake (arrows) (SUVmax 13).
The lesion was correctly classified as T3.
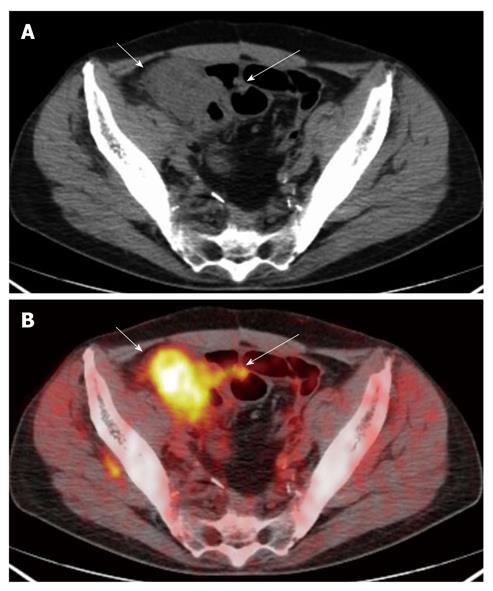
Figure 3 The computed tomography (A) and fused positron emission tomography/computed tomography (B) images show a neoplastic lesion of the caecum concentrating the radio-tracer (short arrows) (SUVmax 9.
6). Focal radio-tracer uptake (SUVmax 3.6) of a contiguous ileal loop was disclosed on positron emission tomography/computed tomography (B) (long arrow) consistent with a short concentric wall thickening (A) (long arrow): the finding was suggestive of small bowel infiltration. The lesion was correctly classified as T4.
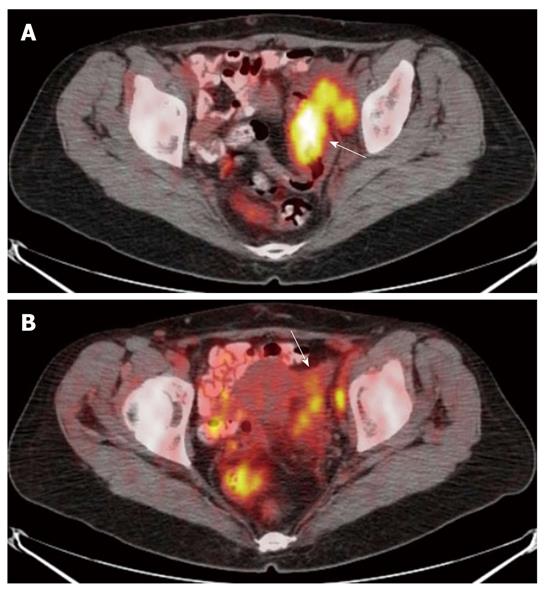
Figure 4 The fused positron emission tomography/computed tomography images show a neoplastic lesion of the sigmoid colon concentrating the radio-tracer (arrow) (SUVmax 14.
6) (A) and focal radio-tracer uptake of the left ovary (arrow) (SUVmax 9) (B): the finding was suggestive of ovarian infiltration. The lesion was correctly classified as T4.
- Citation: Mainenti PP, Iodice D, Segreto S, Storto G, Magliulo M, Palma GDD, Salvatore M, Pace L. Colorectal cancer and 18FDG-PET/CT: What about adding the T to the N parameter in loco-regional staging? World J Gastroenterol 2011; 17(11): 1427-1433
- URL: https://www.wjgnet.com/1007-9327/full/v17/i11/1427.htm
- DOI: https://dx.doi.org/10.3748/wjg.v17.i11.1427


