Copyright
©2010 Baishideng.
World J Gastroenterol. Mar 7, 2010; 16(9): 1097-1103
Published online Mar 7, 2010. doi: 10.3748/wjg.v16.i9.1097
Published online Mar 7, 2010. doi: 10.3748/wjg.v16.i9.1097
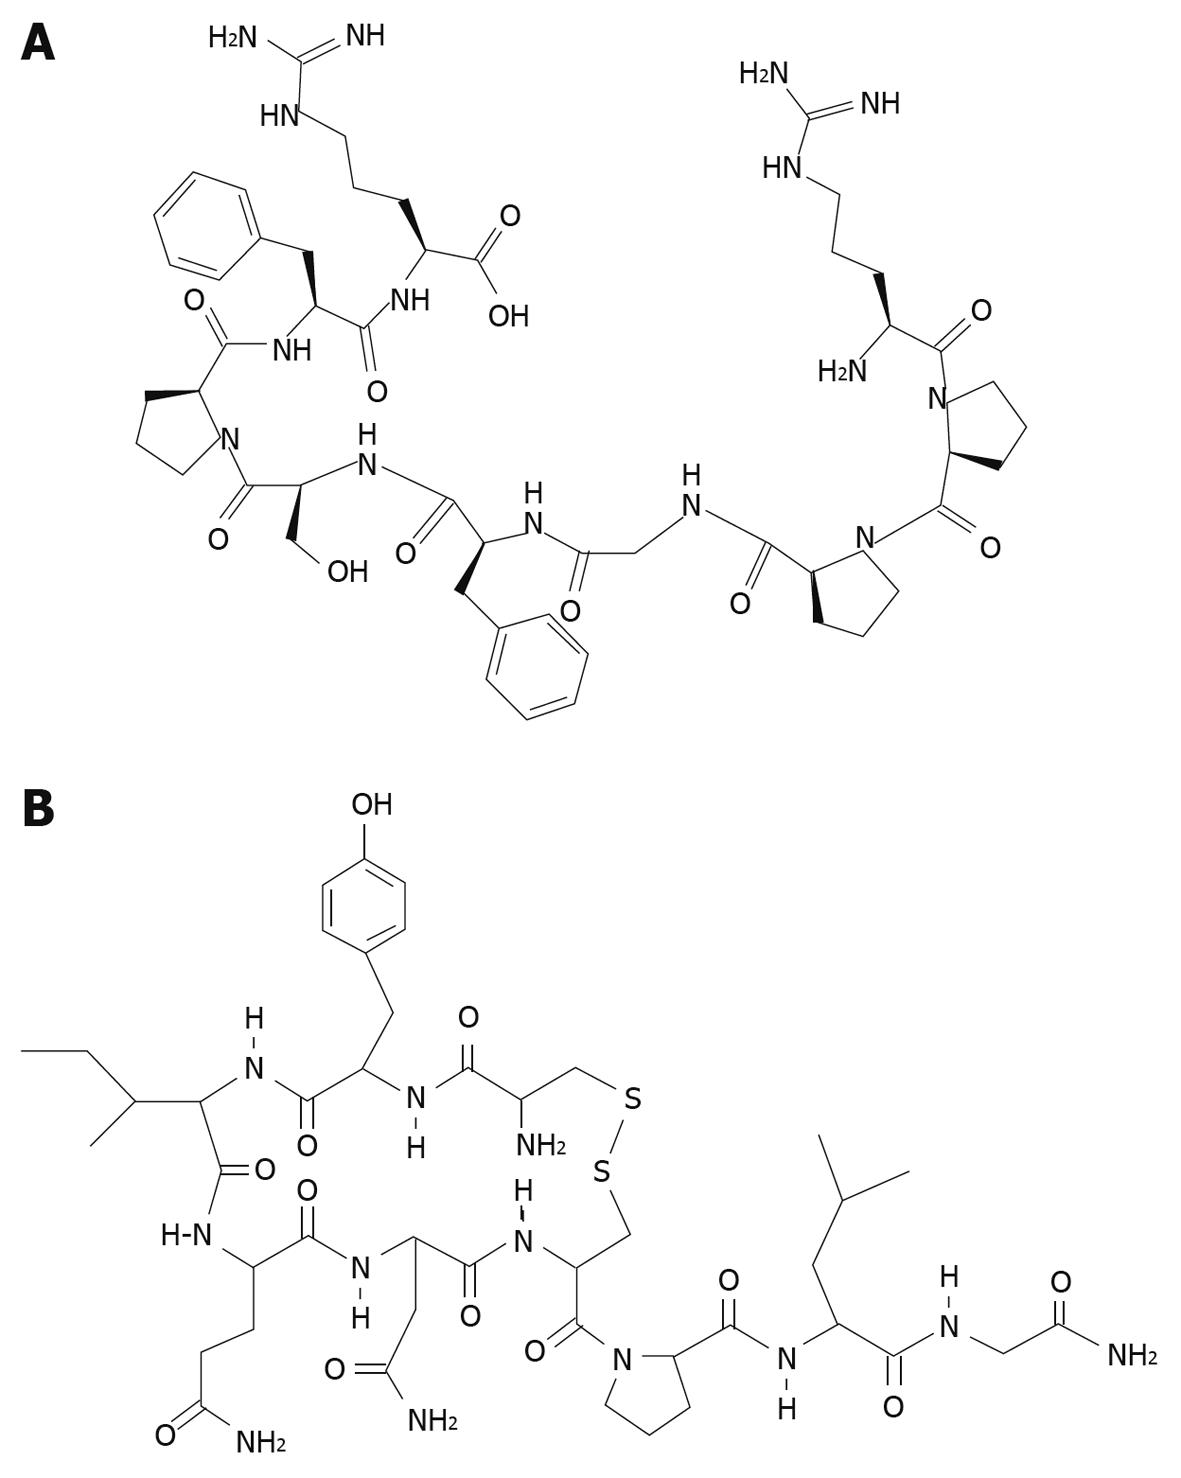
Figure 1 Amino acid structures of bradykinin (top) and oxytocin (bottom).
Note the presence of the disulfide bridge in oxytocin.
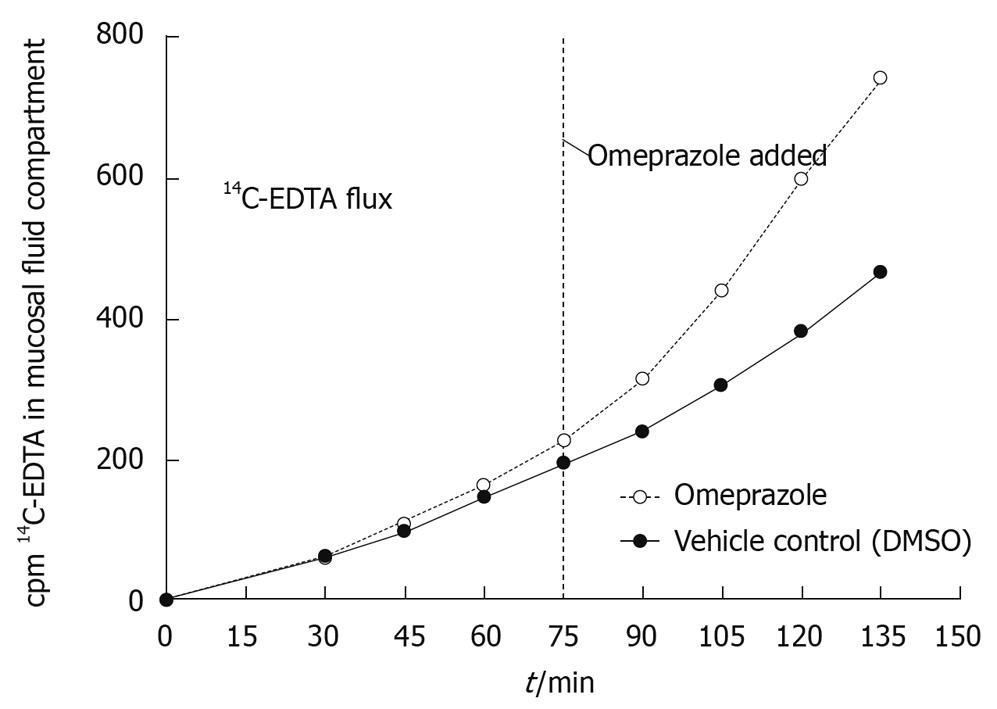
Figure 2 Effect of 200 μmol/L omeprazole on 10 μmol/L 14C-EDTA flux rate across rat corpus mucosa.
The flux rate of 14C-EDTA dramatically increases over time after the addition of omeprazole compared to the DMSO vehicle control. Representative of three experiments and three separate animals. Samples were taken at 15 min intervals beginning at 30 min after the addition of the isotope. Omeprazole and DMSO were added to their respective chambers 75 min after the addition of 14C-EDTA. The total flux time was 135 min. 14C-EDTA was added to the serosal fluid compartment and samples were taken from the mucosal fluid compartment.
Figure 3 3H-bradykinin (panel A) or 3H-oxytocin (panel B) was added to the mucosal fluid compartment at t = 0 to begin the flux period of 180 min.
Omeprazole or DMSO was added to the tissue 90 min after the addition of 3H-peptide. Samples were taken every 45 min for the total 180 min flux period (pre- and post-omeprazole/DMSO) from the serosal fluid compartment for LSC and TLC. Omeprazole increases the rate at which total radioactivity crosses the gastric mucosa compared to the paired vehicle control (DMSO) in a 3H-bradykinin flux experiment (panel A) whereas total radioactivity crossing the tissue in a 3H-oxytocin flux experiment (panel B) remains unchanged after the addition of omeprazole or DMSO. Both panel A and panel B represent two separate experiments and animals.
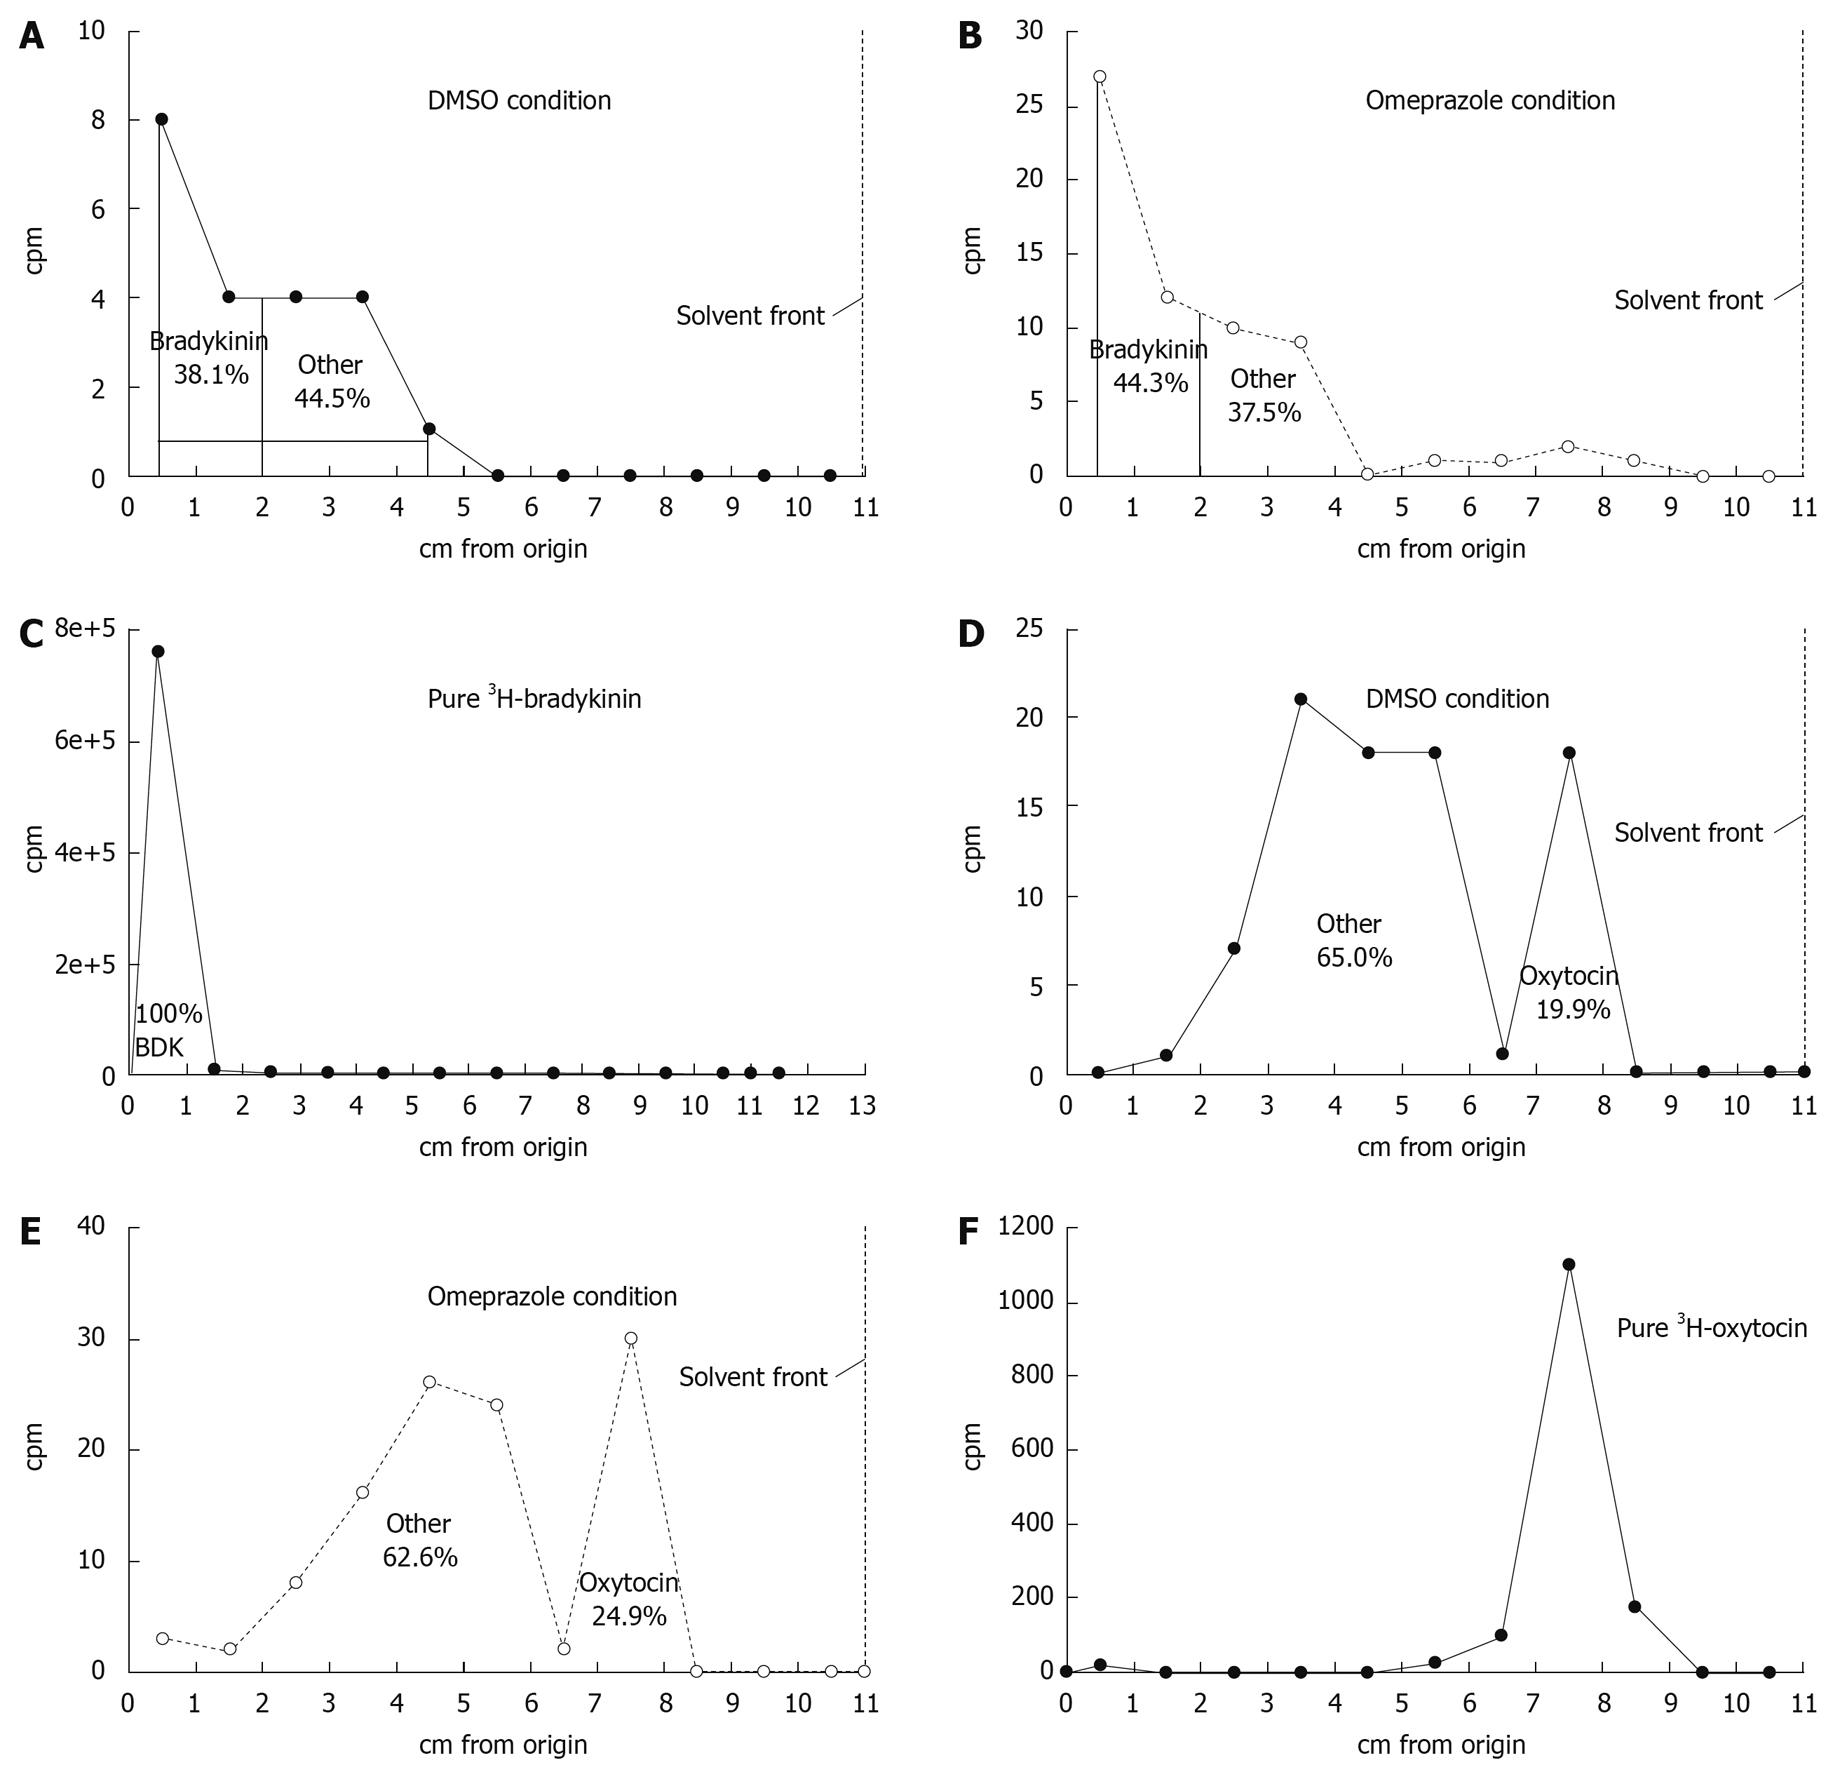
Figure 4 Thin-layer chromatography analysis of 3H crossing the tissue from selected 3H-bradykinin and 3H-oxytocin flux experiments.
The radiochromatograms shown are representative of the total radioactivity present in the serosal fluid compartment at the end of a 180 min flux period from the DMSO (A, D) and omeprazole (B, E) conditions. There are no obvious differences in the proportion of 3H-peptide and 3H-metabolites in either condition. The chromatographic profiles of pure 3H-bradykinin (C) and pure 3H-oxytocin (F) are also shown. 1 cm strips of the chromatogram were cut from the origin to the solvent front. Each strip was counted in a scintillation counter to determine the cpm. The location of 3H-bradykinin or 3H-oxytocin on the chromatogram was detected by its blocking of fluorescence at the origin under a short-wave UV lamp. All radiochromatograms were run in an isopropanol/water/NH4OH (120:30:1) solvent system on silica gel 60 plates with a 254 fluorescent indicator.
Figure 5 Molecular structure of bradykinin (A) and oxytocin (B).
- Citation: Gabello M, Valenzano MC, Zurbach EP, Mullin JM. Omeprazole induces gastric transmucosal permeability to the peptide bradykinin. World J Gastroenterol 2010; 16(9): 1097-1103
- URL: https://www.wjgnet.com/1007-9327/full/v16/i9/1097.htm
- DOI: https://dx.doi.org/10.3748/wjg.v16.i9.1097


