Copyright
©2010 Baishideng.
World J Gastroenterol. Feb 21, 2010; 16(7): 854-861
Published online Feb 21, 2010. doi: 10.3748/wjg.v16.i7.854
Published online Feb 21, 2010. doi: 10.3748/wjg.v16.i7.854
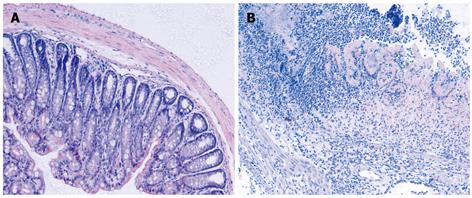
Figure 1 Representative microphotographs of the colon sections stained with hematoxylin and eosin (original magnification, × 100).
A: Control colon; B: Colon was obtained on day 3 after intrarectal TNBS.
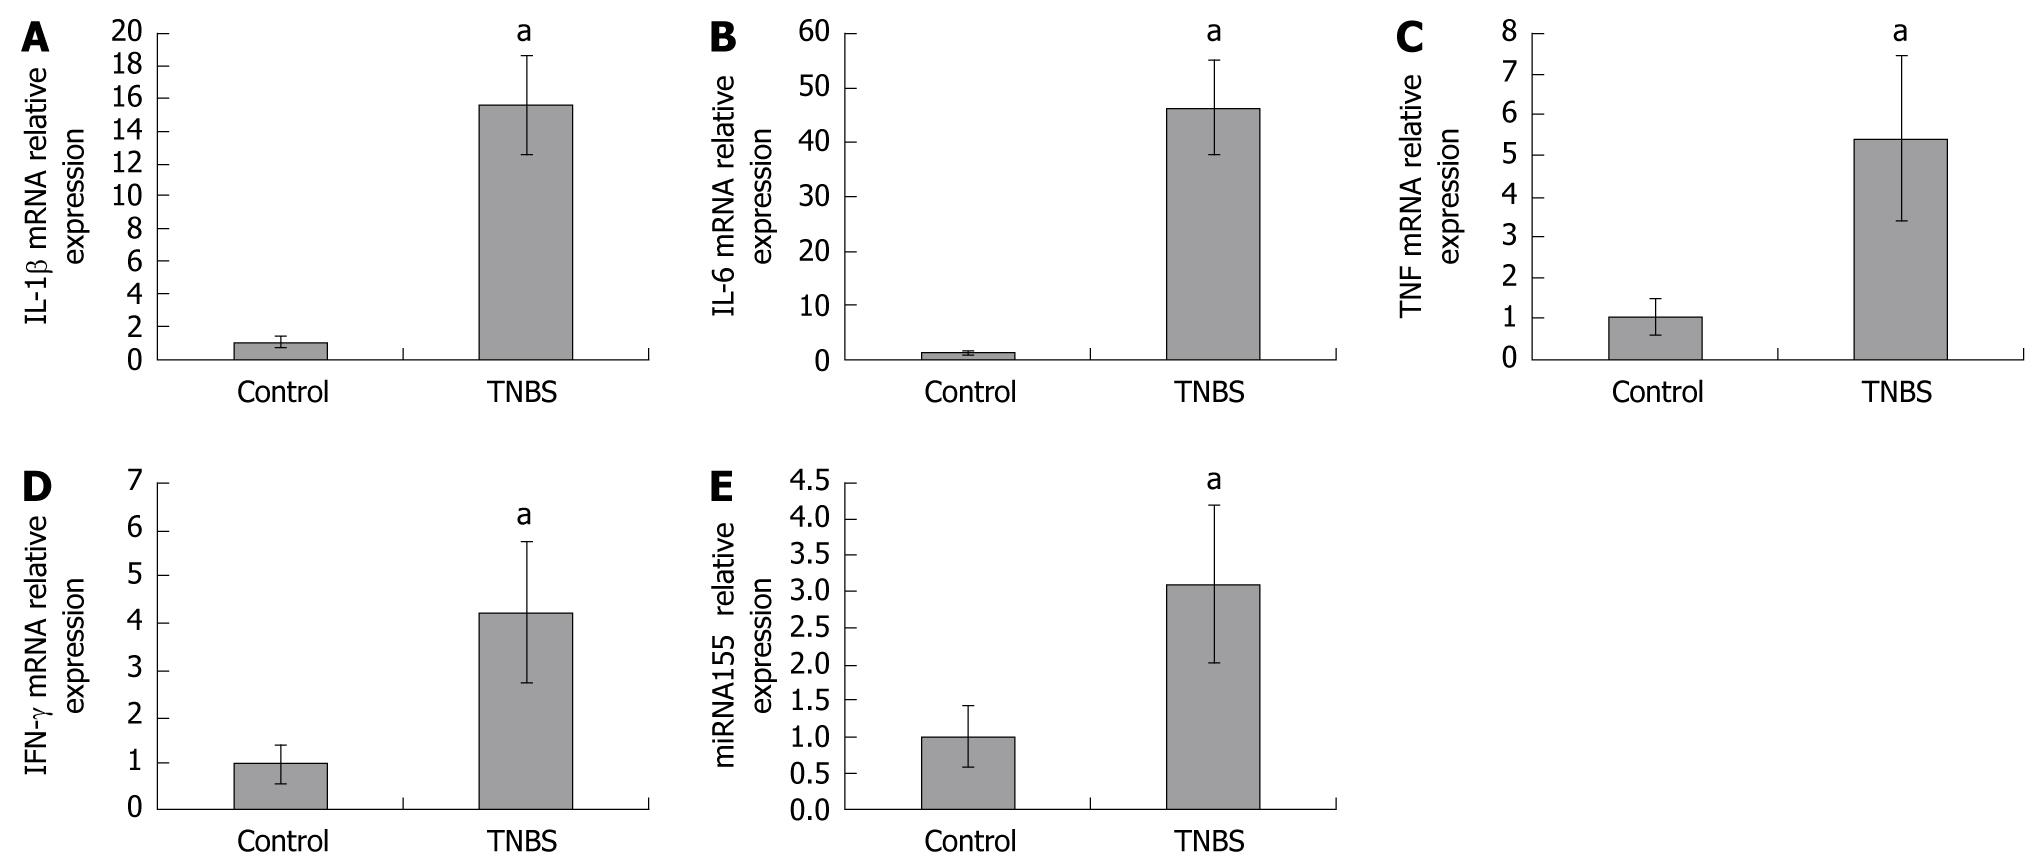
Figure 2 IL-1β (A), IL-6 (B), TNF (C), IFN-γ (D) mRNA and miRNA155 (E) expressions in colon homogenates of control and TNBS colitis groups.
qPCR-derived IL-1β, IL-6, TNF, IFN-γ, and miRNA155 expressions in colon homogenates were significantly increased in TNBS-induced colitis. aP < 0.05 vs control.
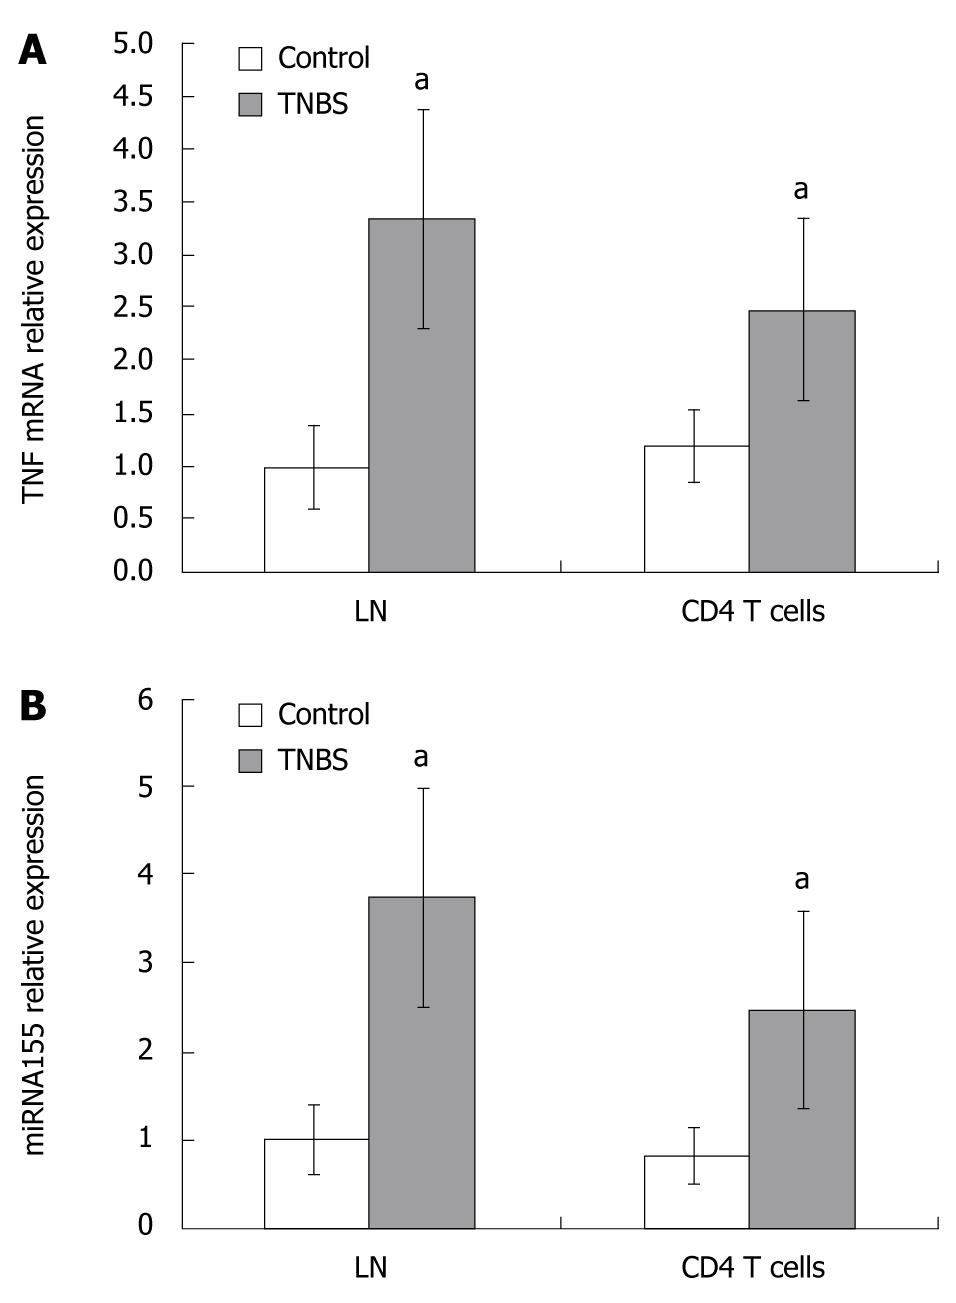
Figure 3 TNF mRNA (A) and miRNA155 (B) expressions in LNs and CD4+ T cells in control and TNBS colitis groups.
TNF mRNA and miRNA155 expressions in LNs and CD4+ T cells were significantly increased in TNBS-induced colitis. aP < 0.05 vs control.
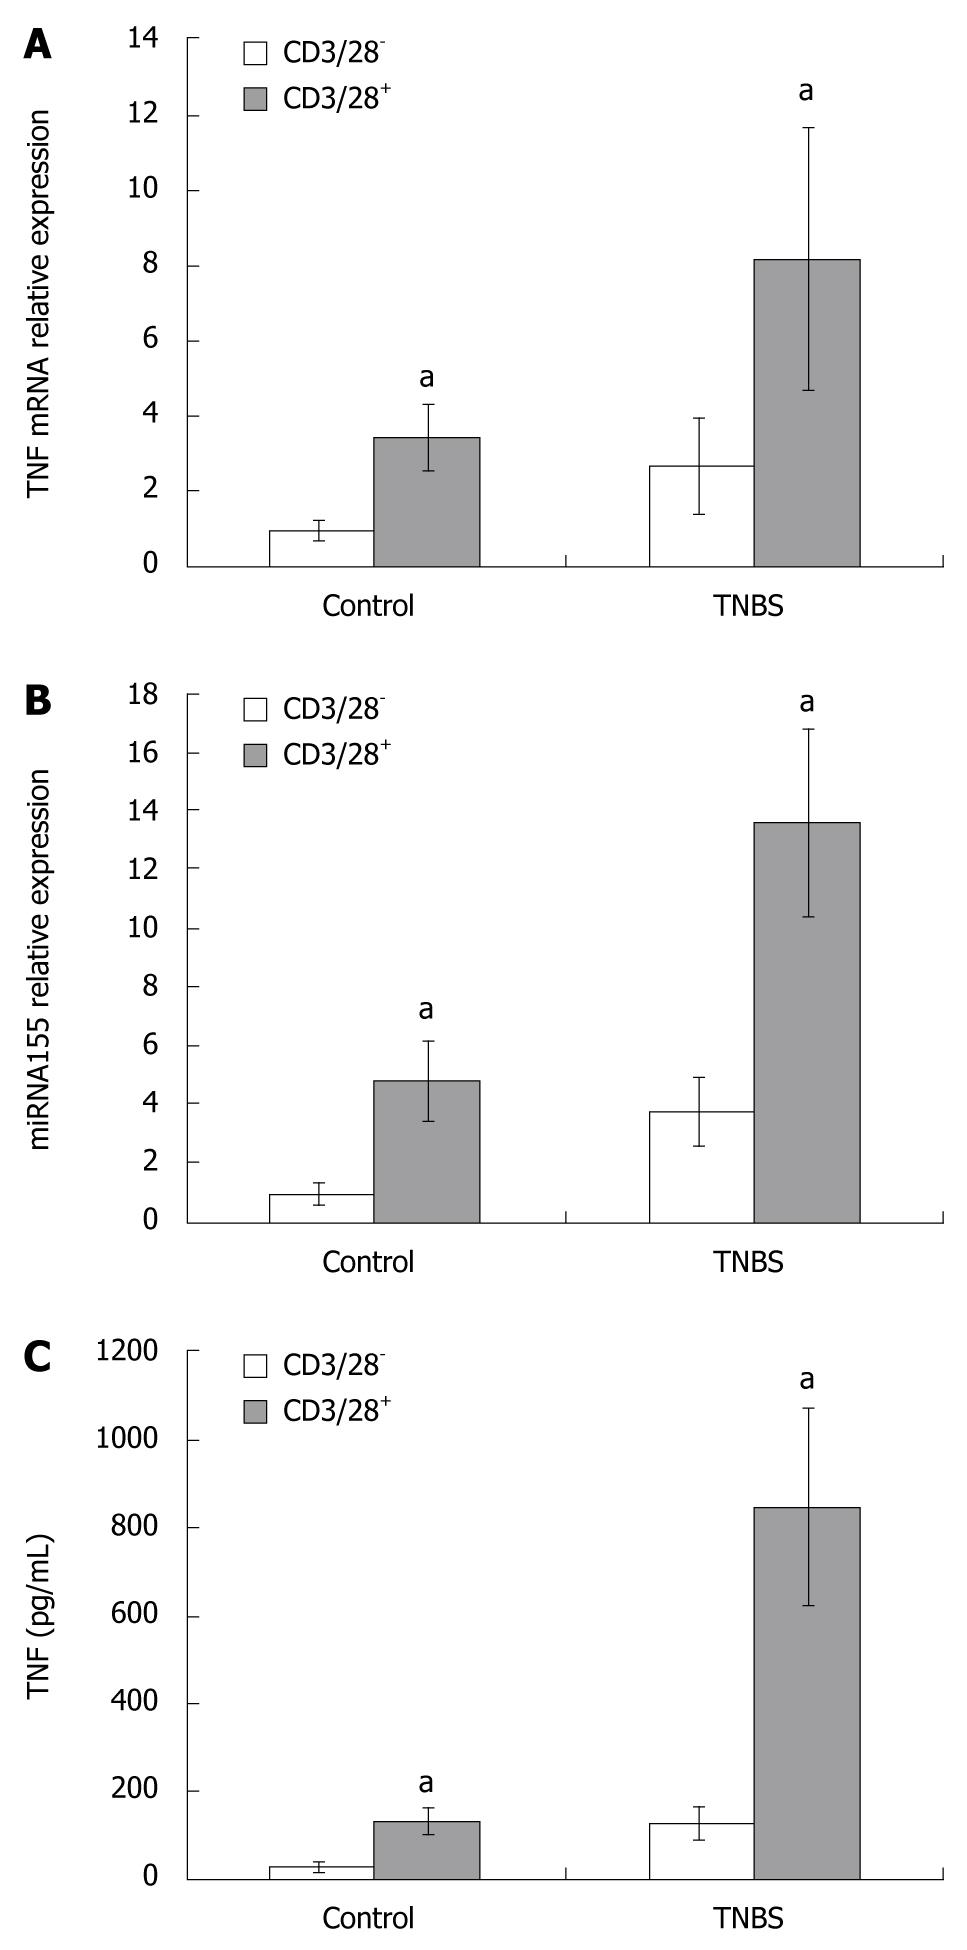
Figure 4 TNF mRNA (A) and miRNA155 (B) expressions in CD4+ T cells cultured with or without anti-CD3/CD28 antibody, and the TNF protein expression (C) in the supernatants of CD4+ T cells culture media with or without anti-CD3/CD28 antibody.
TNF mRNA and miRNA155 expressions in CD4+ T cells cultured with anti-CD3/CD28 antibody, and the TNF concentration in the supernatants of culture media containing anti-CD3/CD28 antibody increased in comparison to those in cells or media cultured without anti-CD3/CD28 antibody. aP < 0.05 vs control.
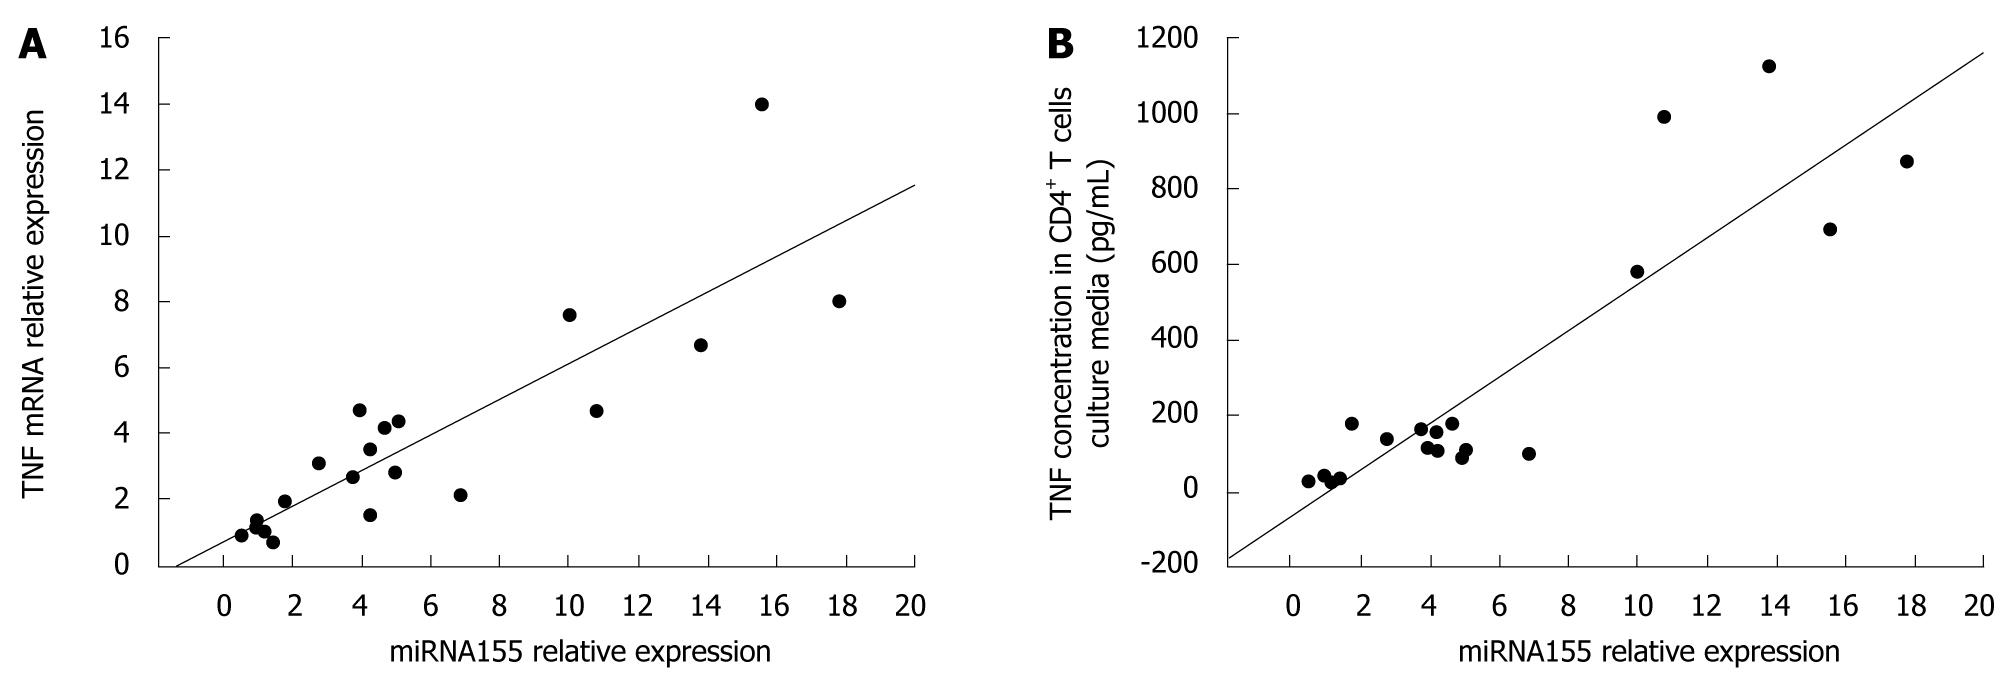
Figure 5 Relationships between miRNA155 expression in CD4+ T cells and TNF mRNA expression in CD4+ T cells (A) or TNF concentration in CD4+ T cells culture media (B).
Data analyzed by Pearson’s correlation coefficient.
- Citation: Chen DF, Gong BD, Xie Q, Ben QW, Liu J, Yuan YZ. MicroRNA155 is induced in activated CD4+ T cells of TNBS-induced colitis in mice. World J Gastroenterol 2010; 16(7): 854-861
- URL: https://www.wjgnet.com/1007-9327/full/v16/i7/854.htm
- DOI: https://dx.doi.org/10.3748/wjg.v16.i7.854


