Copyright
©2010 Baishideng.
World J Gastroenterol. Feb 21, 2010; 16(7): 846-853
Published online Feb 21, 2010. doi: 10.3748/wjg.v16.i7.846
Published online Feb 21, 2010. doi: 10.3748/wjg.v16.i7.846
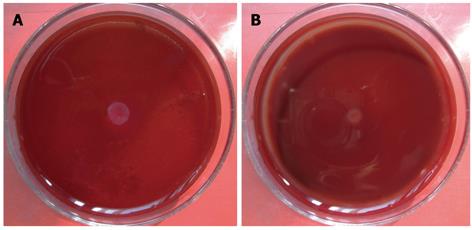
Figure 1 Stab agar motility tests showing the H.
pylori motility. A: DMSO control (1/1000); B: Celecoxib (0.02 mmol/L).
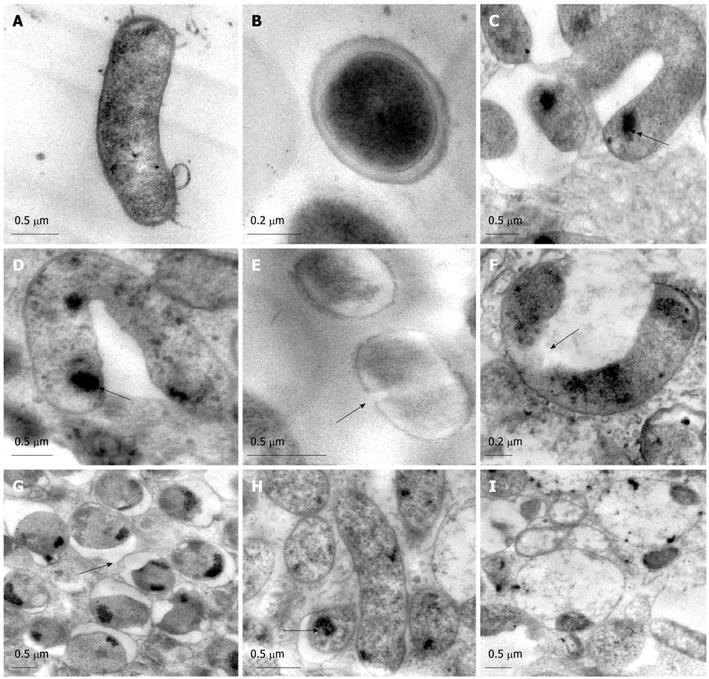
Figure 2 Transmission electron microscopy (TEM).
TEM showing rod-shaped H. pylori (A), well-distributed cytoplasm and moderate electron density (B), U-shaped (C, arrow) and V-shaped (D, arrow) H. pylori, non-integrity (E, arrow) and abscission (F, arrow) of H. pylori cell wall, outer membrane separated from the cytoplasmic membrane (G, arrow), decreased electron density in cytoplasm (H, arrow), and cell lysis (I) after treatment with celecoxib.
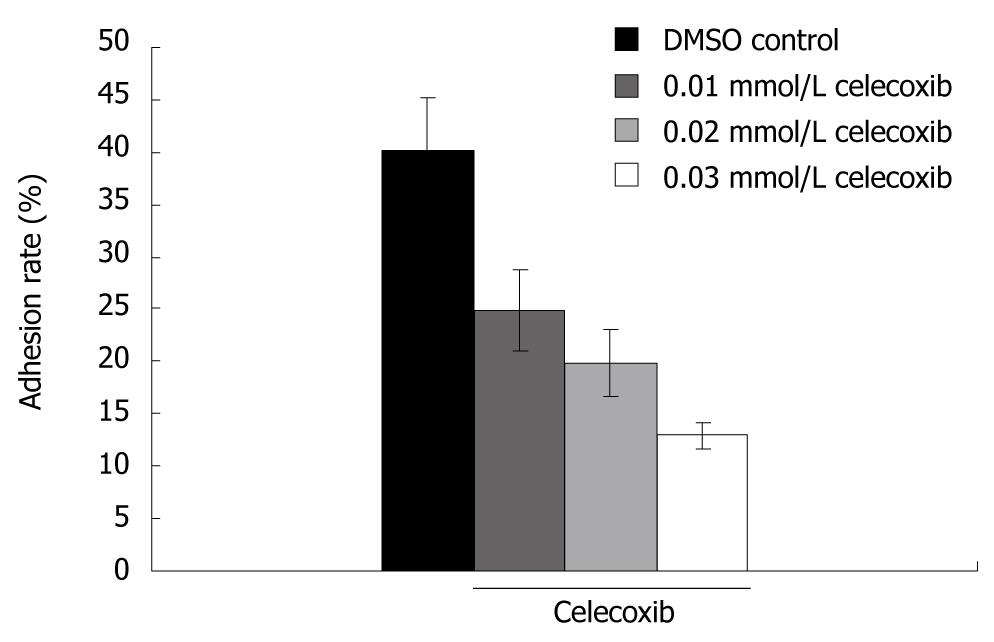
Figure 3 Adhesion of H.
pylori to AGS cells after treatment with celecoxib at different concentrations.
-
Citation: Wang J, Wang WH, Li J, Liu FX. Celecoxib inhibits
Helicobacter pylori colonization-related factors. World J Gastroenterol 2010; 16(7): 846-853 - URL: https://www.wjgnet.com/1007-9327/full/v16/i7/846.htm
- DOI: https://dx.doi.org/10.3748/wjg.v16.i7.846


