Copyright
©2010 Baishideng Publishing Group Co.
World J Gastroenterol. Dec 28, 2010; 16(48): 6128-6134
Published online Dec 28, 2010. doi: 10.3748/wjg.v16.i48.6128
Published online Dec 28, 2010. doi: 10.3748/wjg.v16.i48.6128
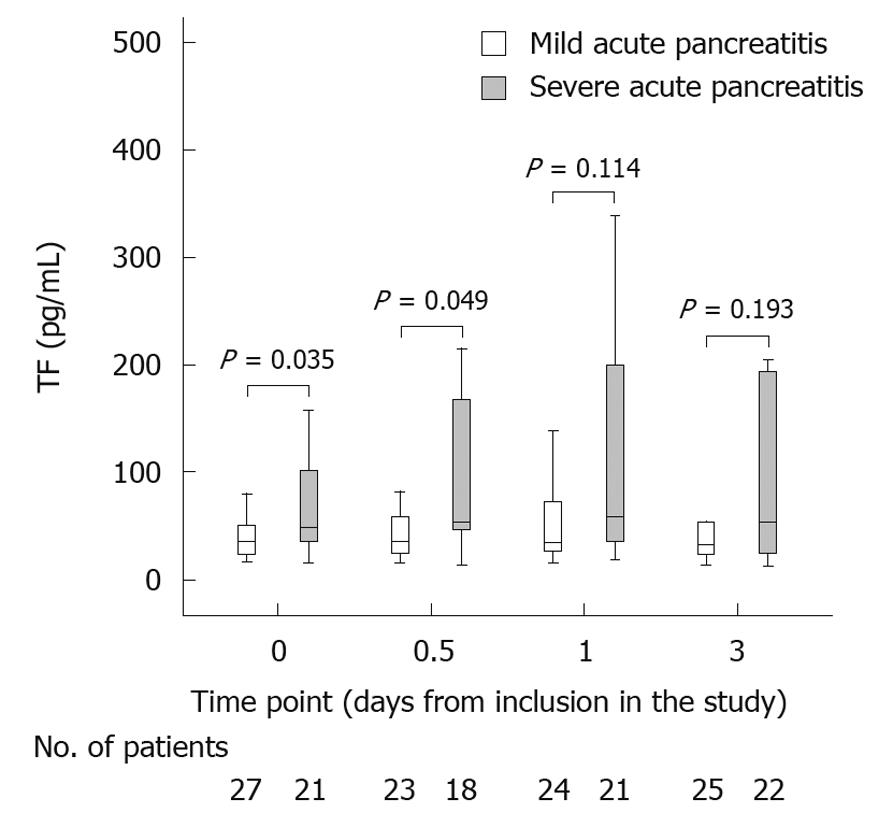
Figure 1 Tissue factor.
Time points: 0 = inclusion in study, 0.5 = 12 h, 1 = 24 h, 3 = 3 d. TF: Tissue factor.
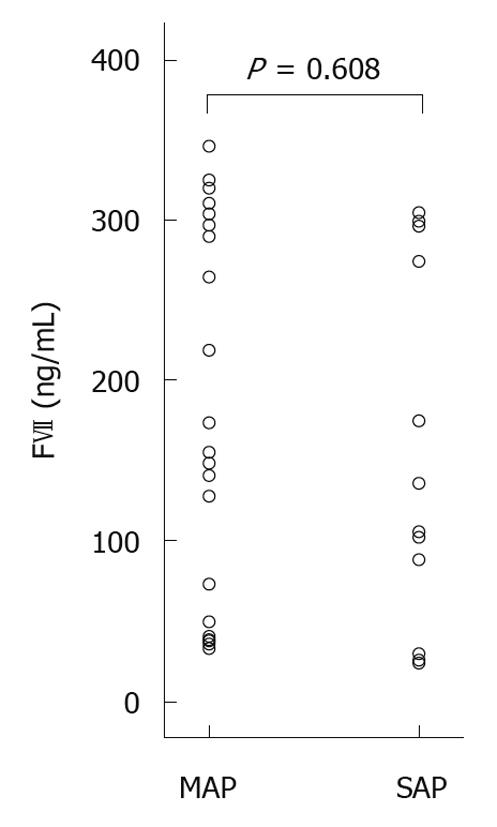
Figure 2 Scattergram of factor VII plasma levels at inclusion (ng/mL).
FVII: Factor VII; MAP: Mild acute pancreatitis; SAP: Severe acute pancreatitis.
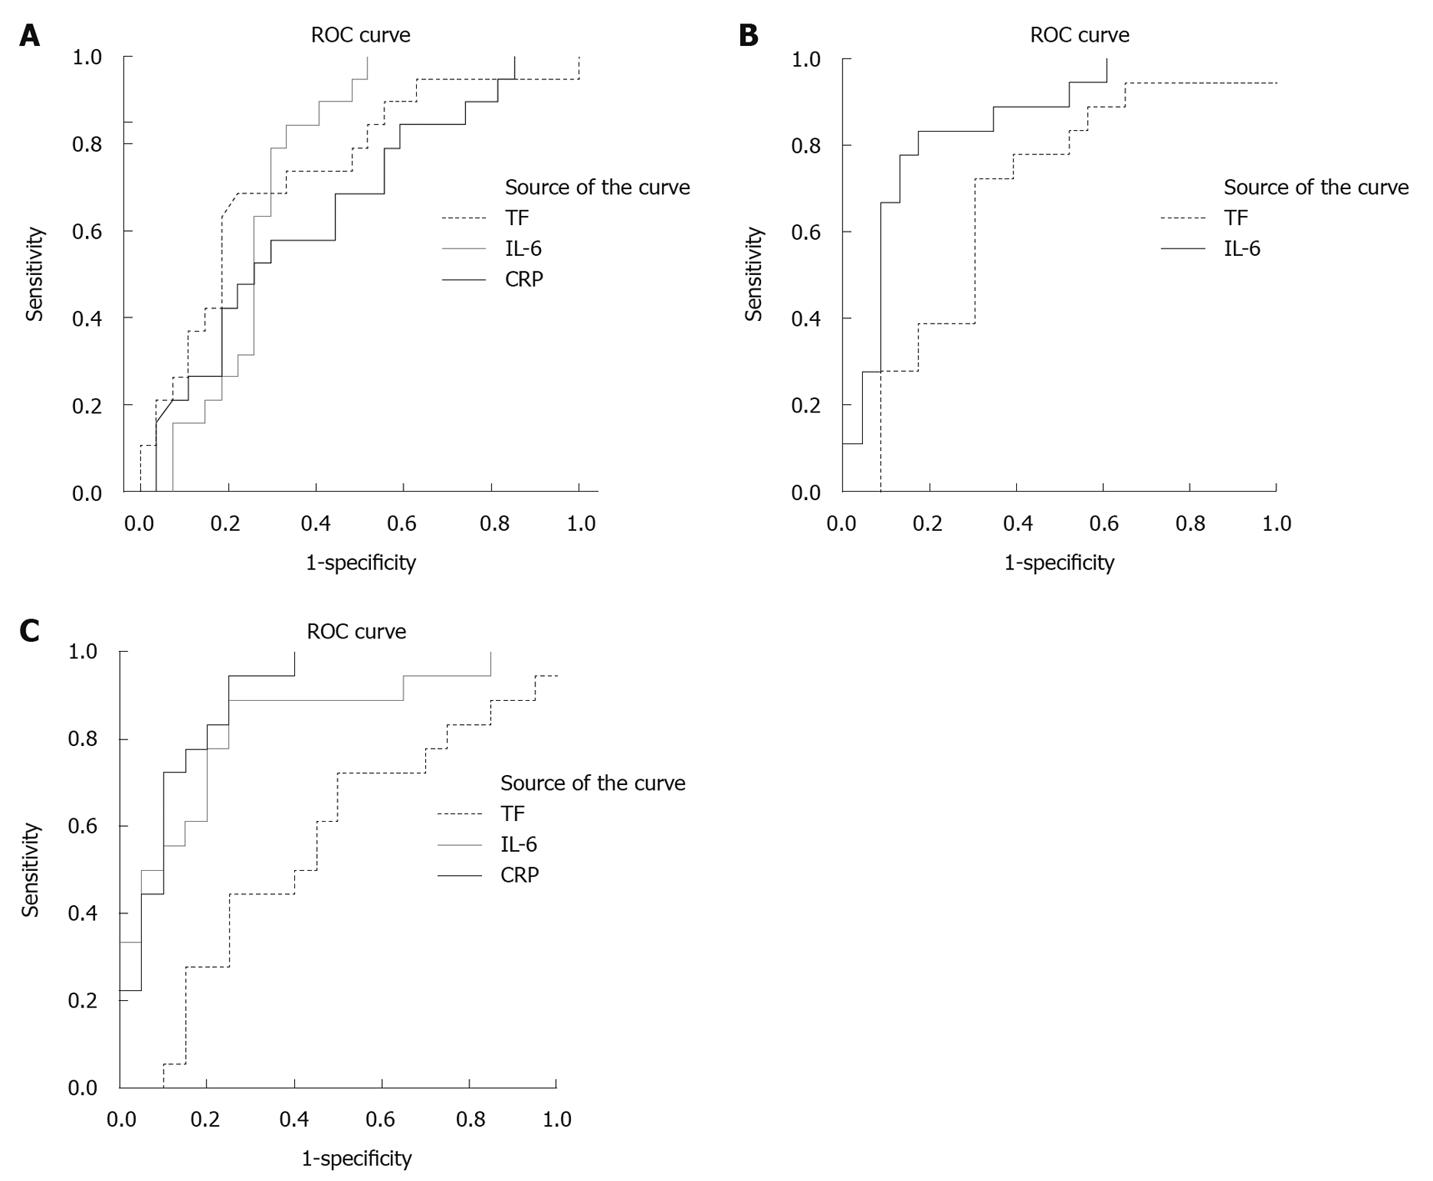
Figure 3 Receiver operating characteristic curves.
A: Receiver operating characteristic (ROC) curves of tissue factor (TF), interleukin-6 (IL-6) and C-reactive protein (CRP) at time of inclusion in the study; B: ROC curves of TF and IL-6 at 12 h after inclusion in the study; C: ROC curves of TF, IL-6 and CRP at 3 d after inclusion.
- Citation: Andersson E, Axelsson J, Eckerwall G, Ansari D, Andersson R. Tissue factor in predicted severe acute pancreatitis. World J Gastroenterol 2010; 16(48): 6128-6134
- URL: https://www.wjgnet.com/1007-9327/full/v16/i48/6128.htm
- DOI: https://dx.doi.org/10.3748/wjg.v16.i48.6128


