Copyright
copy;2010 Baishideng Publishing Group Co.
World J Gastroenterol. Oct 21, 2010; 16(39): 4944-4951
Published online Oct 21, 2010. doi: 10.3748/wjg.v16.i39.4944
Published online Oct 21, 2010. doi: 10.3748/wjg.v16.i39.4944
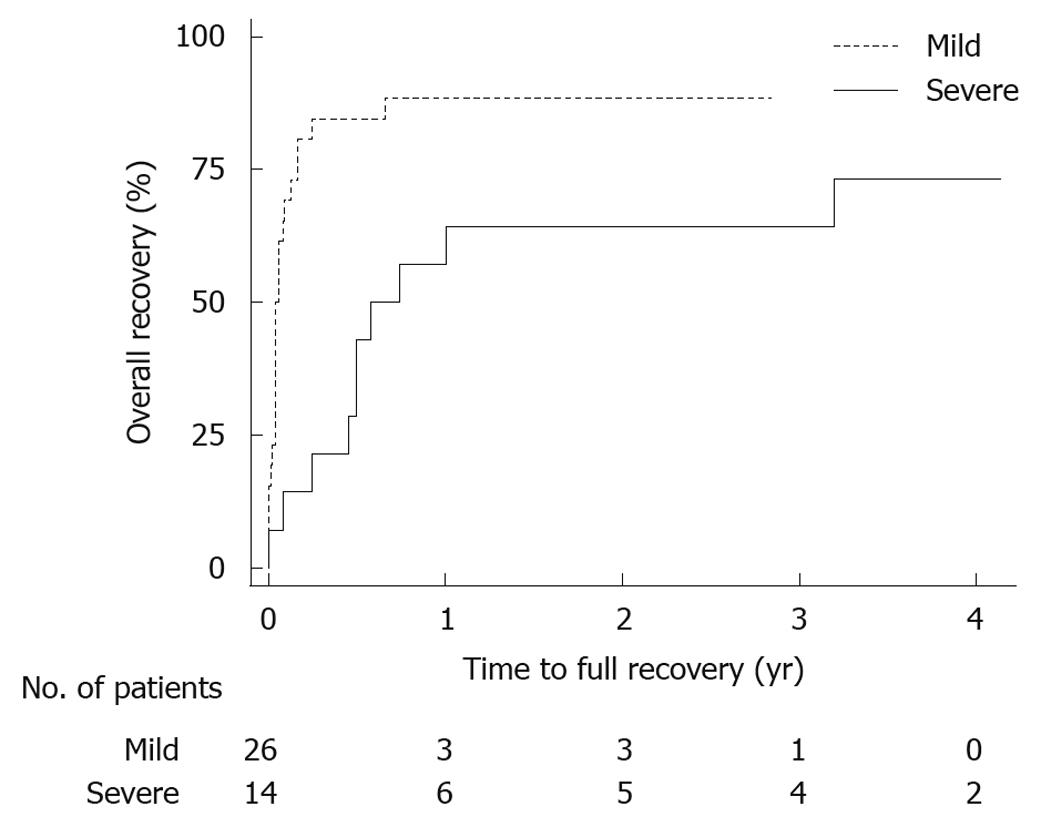
Figure 1 Log-rank test for time to recovery after acute pancreatitis in mild and severe acute pancreatitis patients.
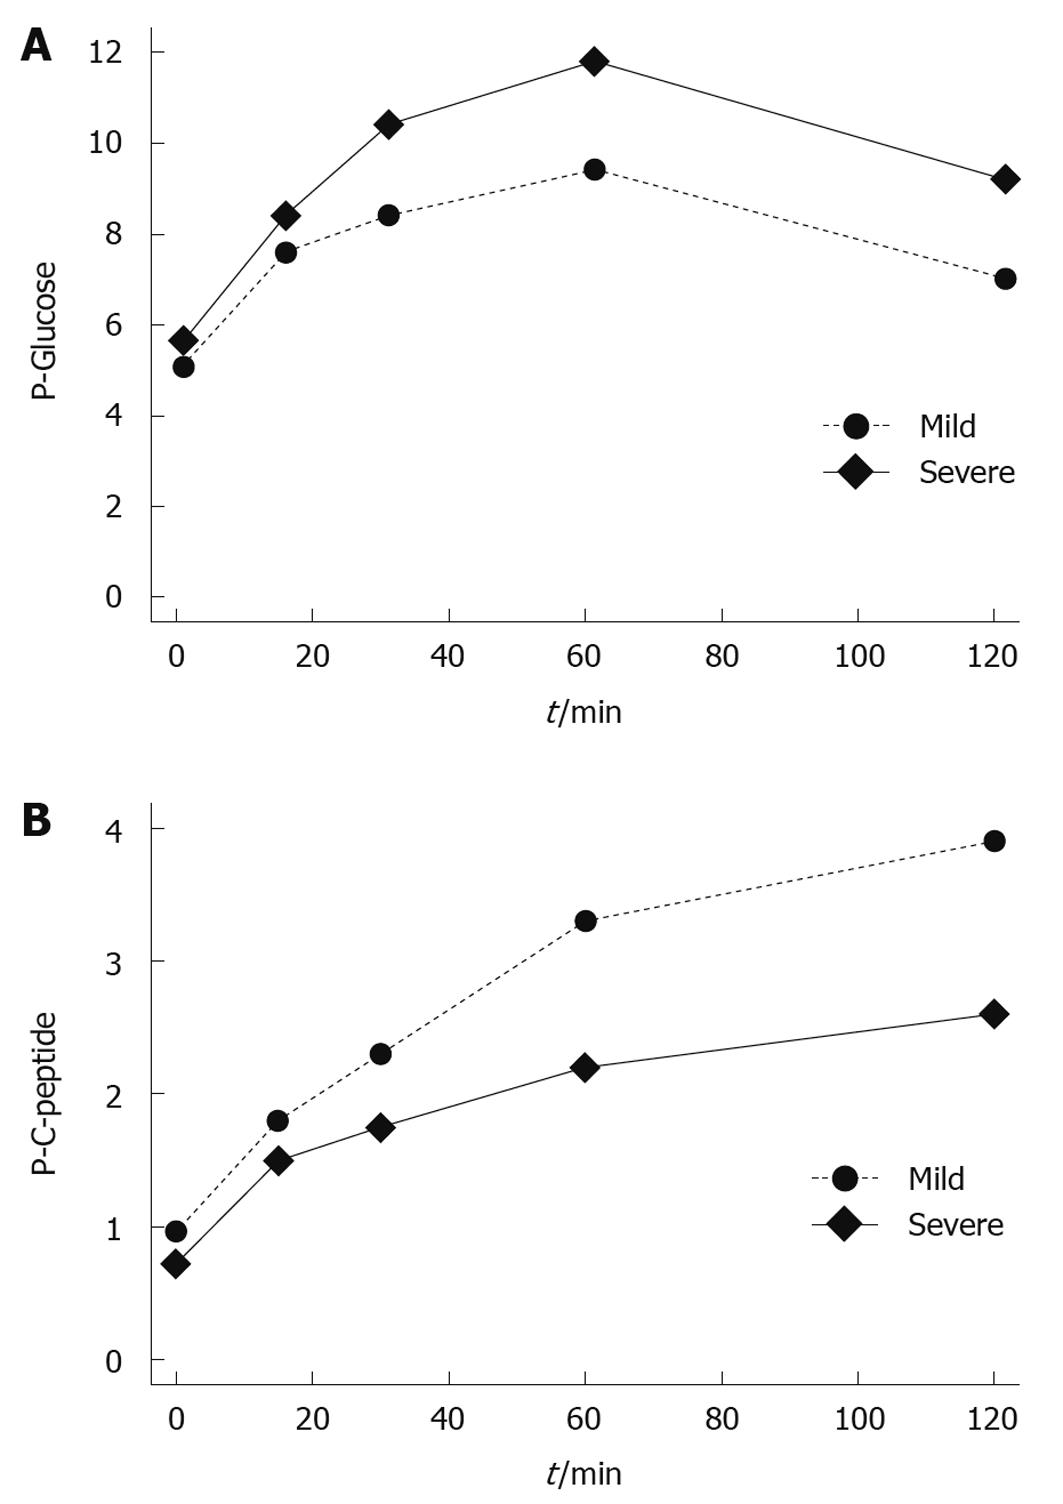
Figure 2 Relationship between mild and severe acute pancreatitis patients in the oral glucose tolerance test evaluating plasma glucose (mmol/L, A) and C-peptide values (nmol/L, B).
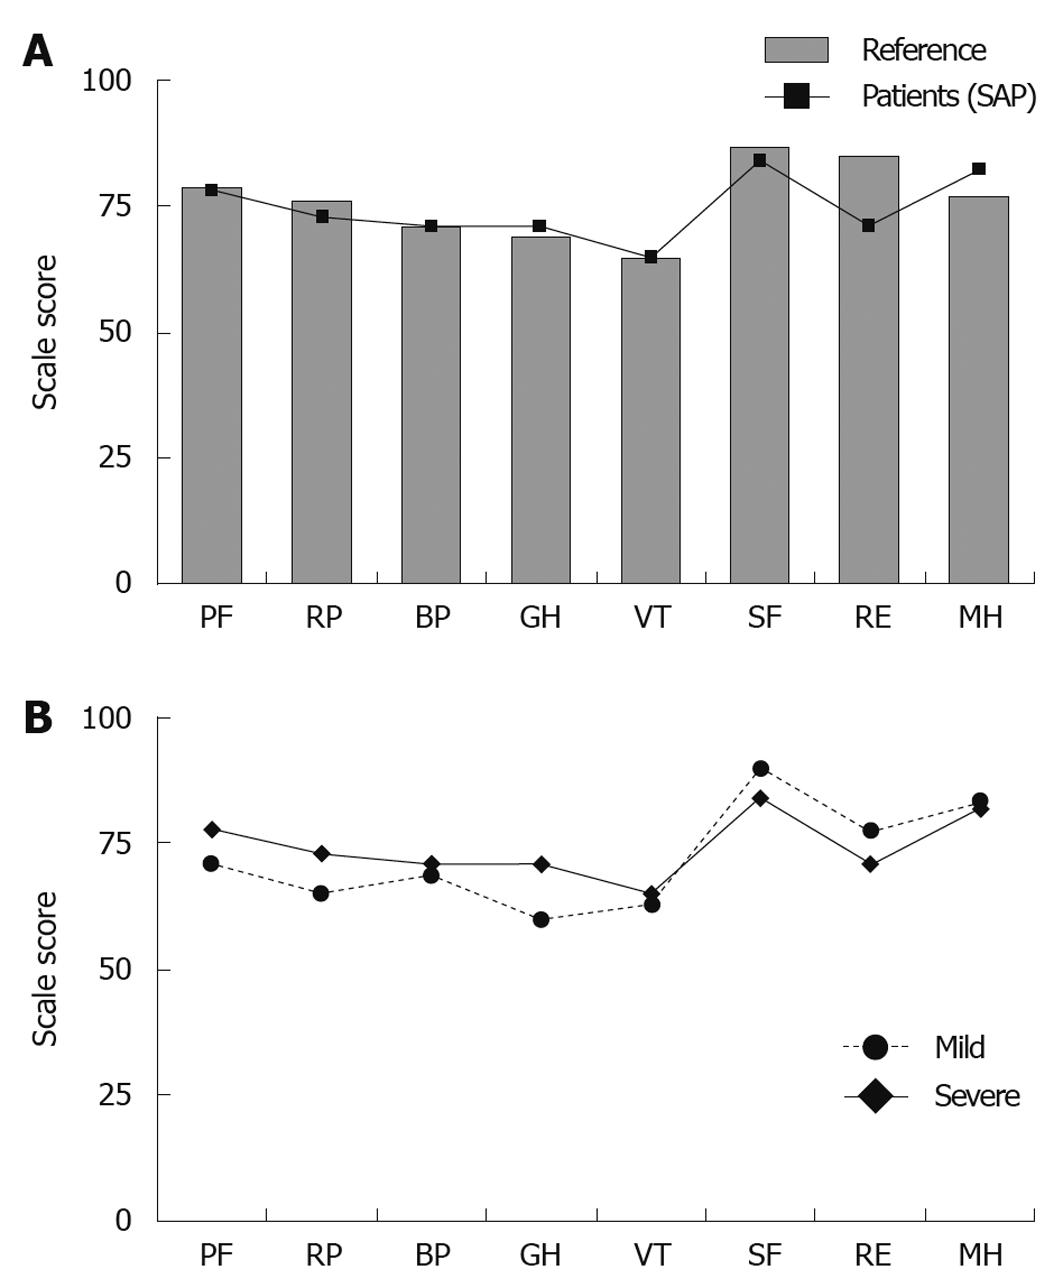
Figure 3 The graphs shows quality of life, measured by Short Form-36, in mild and severe acute pancreatitis patients, comparing age- and gender-matched control group.
A: Mean values for patients after mild (black squares) acute pancreatitis and severe (black circles) acute pancreatitis in the 8 Short Form-36 domains; B: Mean value for patients after severe (black squares) acute pancreatitis compared with an age- and gender-matched control group (grey bars) in the 8 SF-36 domains. SAP: Severe acute pancreatitis; PF: Physical function; RP: Role physical; BP: Bodily pain; GH: General health; VT: Vitality; SF: Social functioning; RE: Role emotional; MH: Mental health.
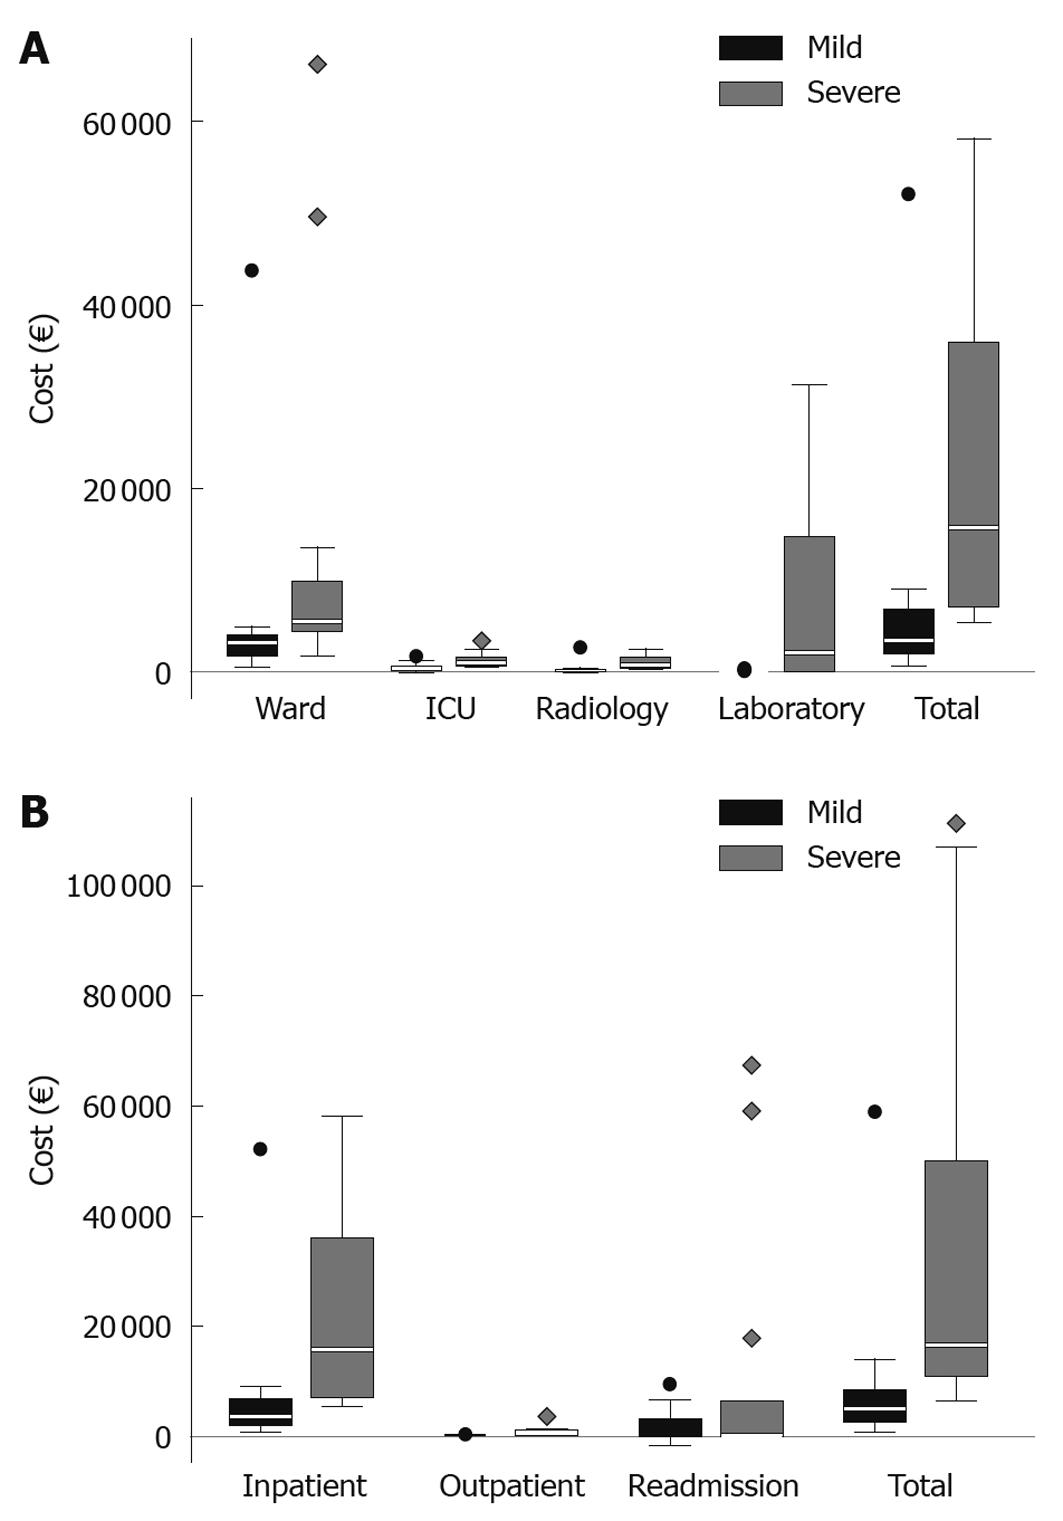
Figure 4 Box-plots showing the specified hospital costs in acute pancreatitis patients.
A: In-hospital costs during primary care for acute pancreatitis, in mild and severe acute pancreatitis patients; B: Costs at follow-up, including cost for primary care and all subsequent inpatient and outpatient costs, in mild and severe acute pancreatitis patients. ICU: Intensive care unit.
- Citation: Andersson B, Pendse ML, Andersson R. Pancreatic function, quality of life and costs at long-term follow-up after acute pancreatitis. World J Gastroenterol 2010; 16(39): 4944-4951
- URL: https://www.wjgnet.com/1007-9327/full/v16/i39/4944.htm
- DOI: https://dx.doi.org/10.3748/wjg.v16.i39.4944


