Copyright
©2010 Baishideng Publishing Group Co.
World J Gastroenterol. Oct 14, 2010; 16(38): 4876-4879
Published online Oct 14, 2010. doi: 10.3748/wjg.v16.i38.4876
Published online Oct 14, 2010. doi: 10.3748/wjg.v16.i38.4876
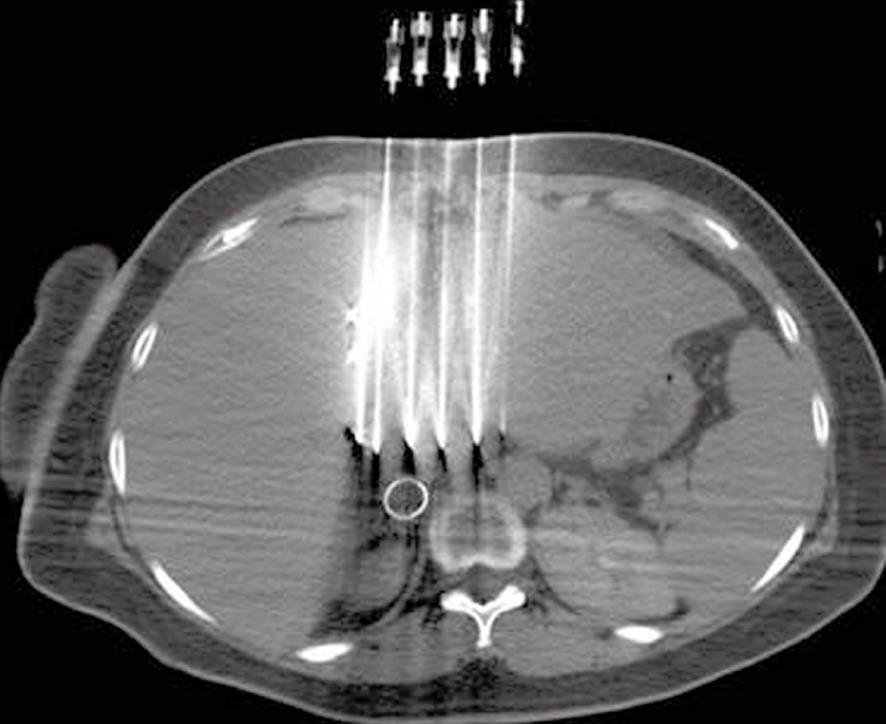
Figure 1 125I seed implantation process.
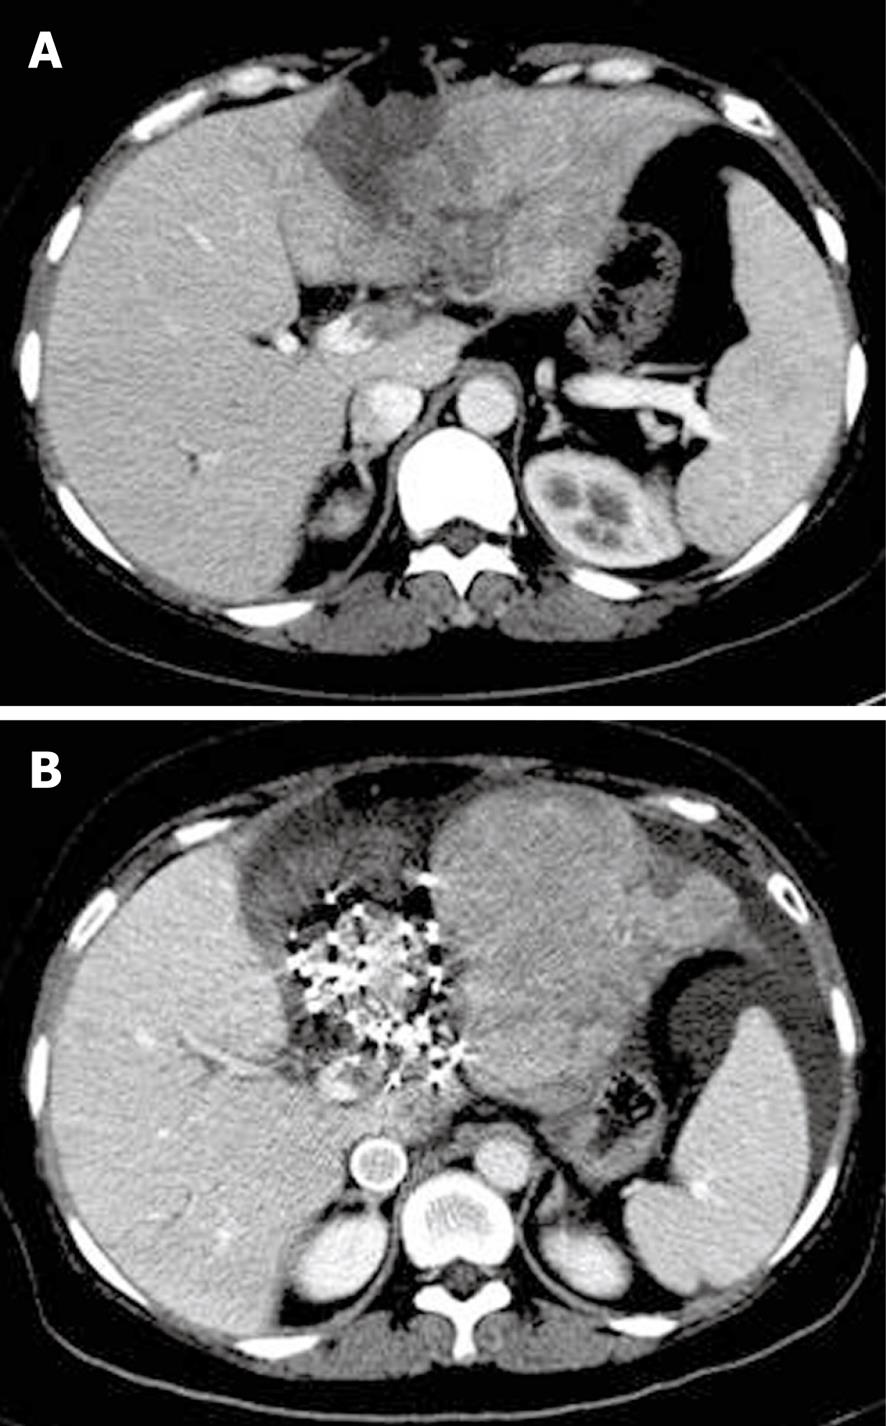
Figure 2 Enhanced computed tomography shows thrombus before 125I seed implantation (A) and absence of tumor thrombi 3 mo after 125I seed implantation (B).
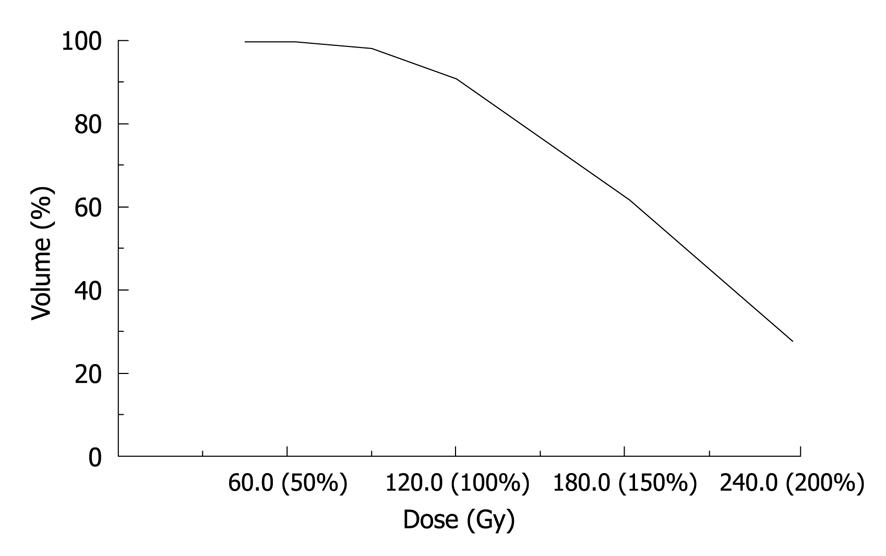
Figure 3 A histogram of therapeutic dose of normal and tumor tissues.
target volume = 10.0 cm3, planning target volume = 13.7 cm3, target volume ratio = 137.4%, volume fraction for prescription, 100% = 91.2%, volume fraction for prescription, 150% = 63.5%, dose homogeneity index = 30.4%, dose non-uniformity ratio = 69.6%.
Figure 4 Enhanced computed tomography shows thrombus before 125I seed implantation (A) and absence of tumor thrombi 4 mo after 125I seed implantation (B).
- Citation: Zhang L, Mu W, Hu CF, Huang XQ. Treatment of portal vein tumor thrombus using 125Iodine seed implantation brachytherapy. World J Gastroenterol 2010; 16(38): 4876-4879
- URL: https://www.wjgnet.com/1007-9327/full/v16/i38/4876.htm
- DOI: https://dx.doi.org/10.3748/wjg.v16.i38.4876


