Copyright
copy;2010 Baishideng Publishing Group Co.
World J Gastroenterol. Sep 7, 2010; 16(33): 4145-4151
Published online Sep 7, 2010. doi: 10.3748/wjg.v16.i33.4145
Published online Sep 7, 2010. doi: 10.3748/wjg.v16.i33.4145
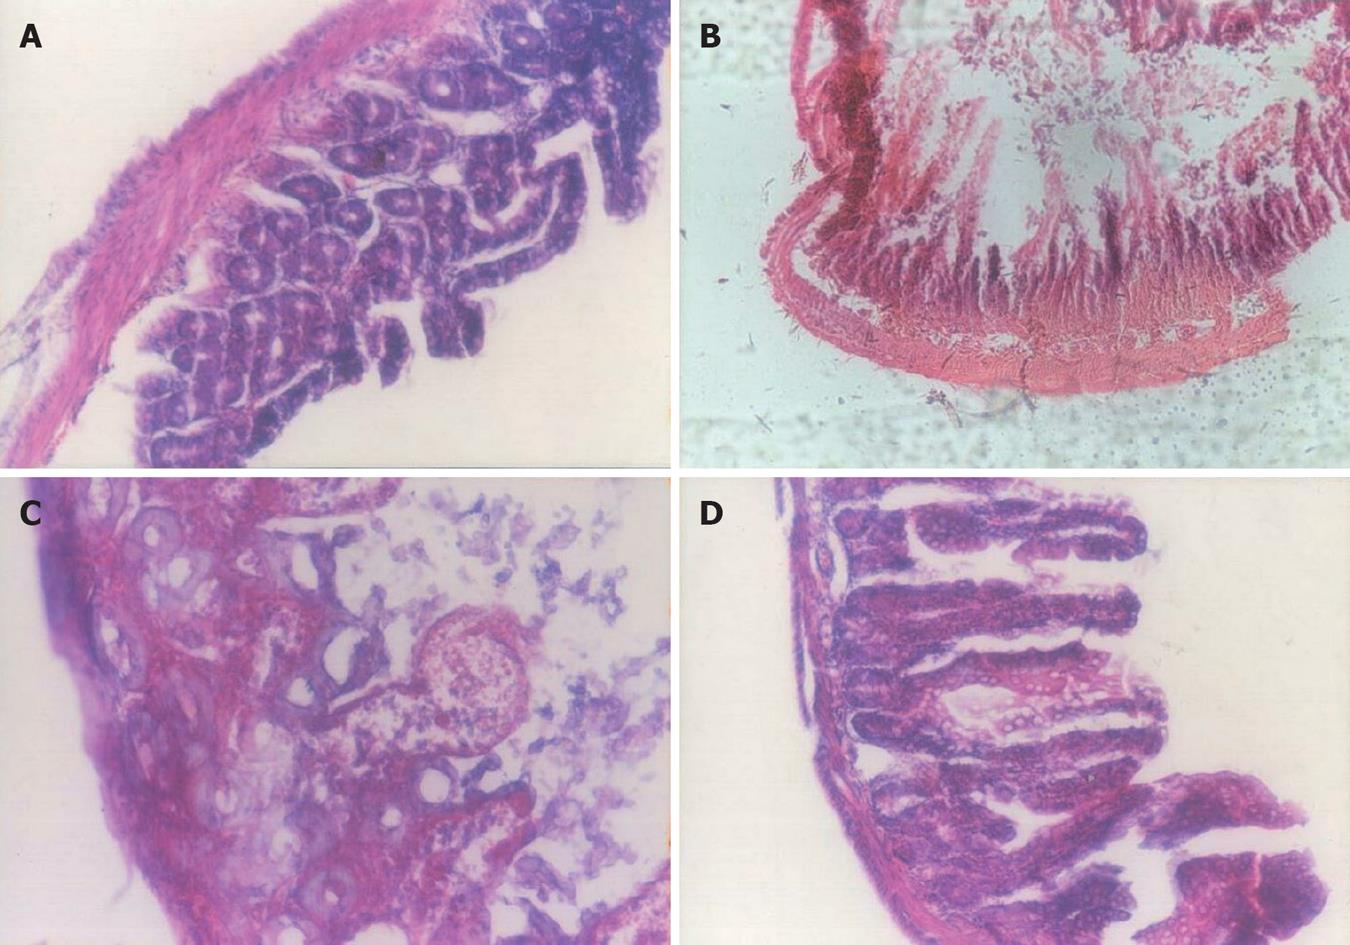
Figure 1 Hematoxylin and eosin staining of colonic tissue (HE, × 250).
A: Control group showed no damage; B: Patients before treatment showed necrotic destruction of the epithelium, inflammatory cellular infiltration, and ulceration of the mucosa and submucosa; C: Sulfasalazine group showed attenuation of the extent and severity of the histological signs; D: Probiotic group showed inhibition of the extent of inflammation, and prevention of mucosal injury.
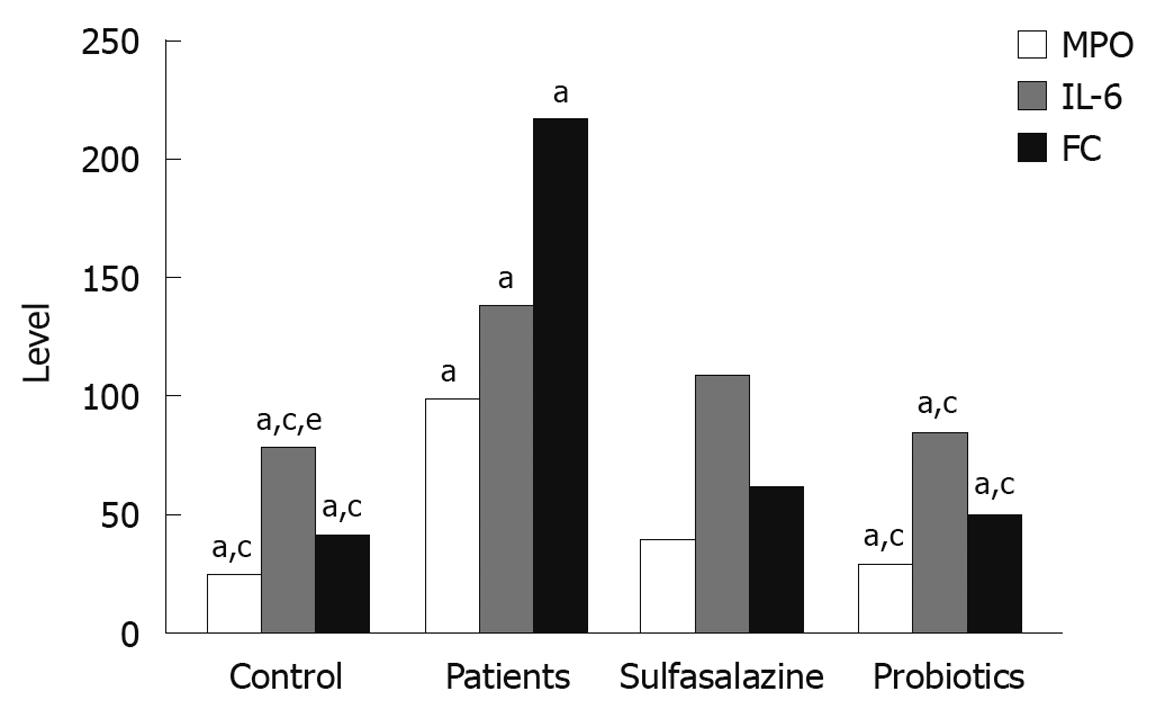
Figure 2 Myeloperoxidase activity (g/U), interleukin-6 level (pg/mL), and fecal calprotectin (g/kg) in colon of ulcerative colitis patients and controls.
Data are presented as mean ± SD. aP < 0.05 vs sulfasalazine; cP < 0.05 vs patients; eP < 0.05 vs interleukin-6 level of the probiotics. MPO: Myeloperoxidase; IL-6: Interleukin-6; FC: Fecal calprotectin.
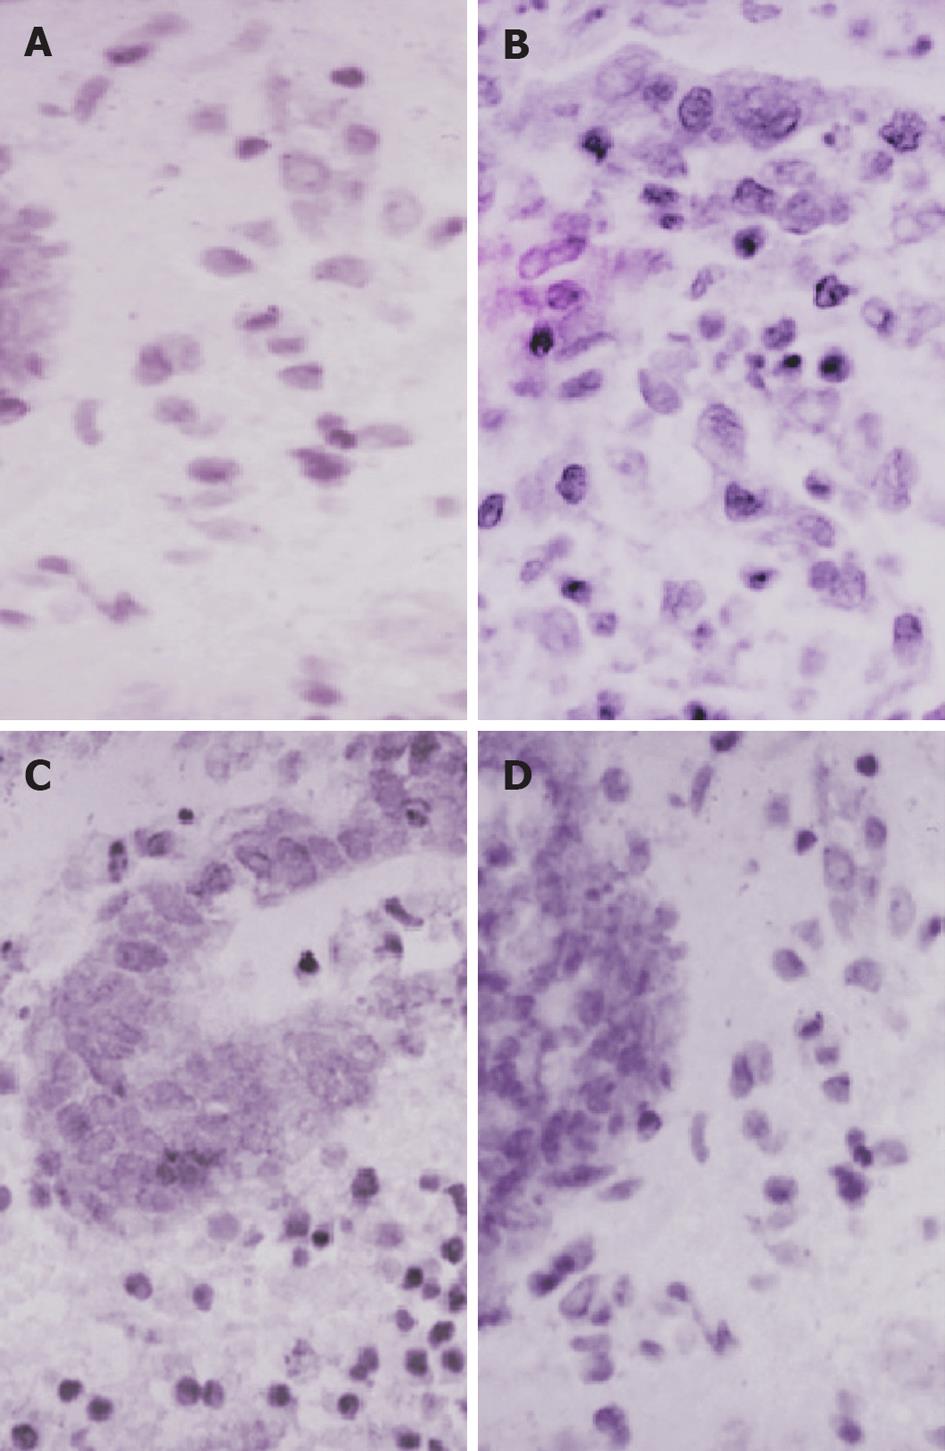
Figure 3 Immunohistochemical staining for nuclear factor-κB p65 (Brown staining, SP × 700).
A: Section of colon from controls showing normal structure and architecture; B: Section of colon from ulcerative colitis patients before treatment showing extensive nuclear factor (NF)-κB (brown) expression; C: Section of colon from sulfasalazine group showing limited NF-κB (brown) expression; D: Section of colon from probiotic group showing minimal NF-κB (brown) expression.
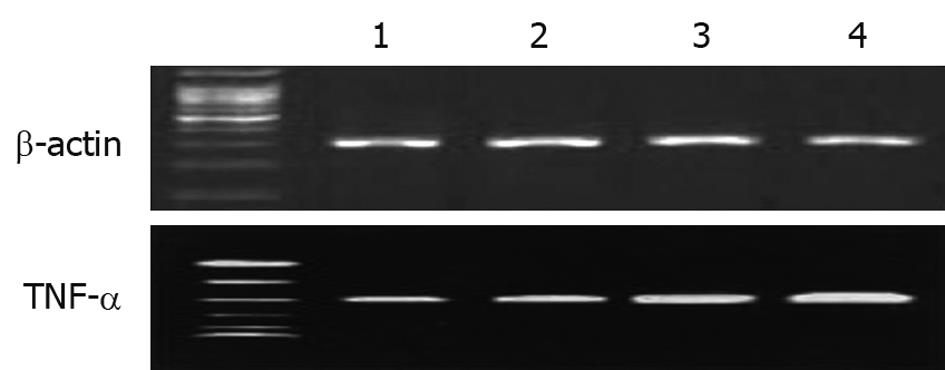
Figure 4 Expression of tumor necrosis factor-α mRNA.
Lane 1: Control group; Lane 2: Probiotic group; Lane 3: Sulfasalazine group; Lane 4: Ulcerative colitis patients before treatment. TNF-α: Tumor necrosis factor-α.
- Citation: Hegazy SK, El-Bedewy MM. Effect of probiotics on pro-inflammatory cytokines and NF-κB activation in ulcerative colitis. World J Gastroenterol 2010; 16(33): 4145-4151
- URL: https://www.wjgnet.com/1007-9327/full/v16/i33/4145.htm
- DOI: https://dx.doi.org/10.3748/wjg.v16.i33.4145


