Copyright
©2010 Baishideng.
World J Gastroenterol. Aug 7, 2010; 16(29): 3603-3615
Published online Aug 7, 2010. doi: 10.3748/wjg.v16.i29.3603
Published online Aug 7, 2010. doi: 10.3748/wjg.v16.i29.3603
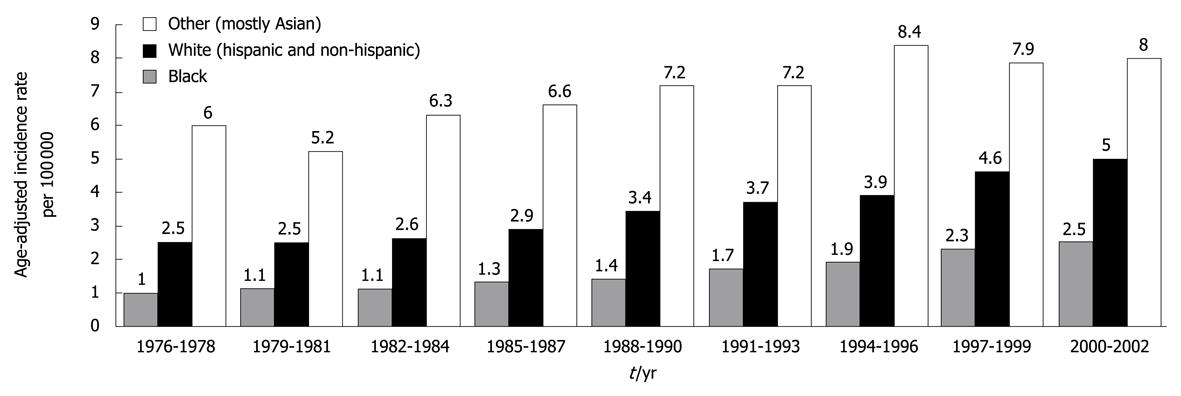
Figure 1 Average yearly, age-adjusted incidence rates for hepatocellular carcinoma men and women in the United States shown for 3-year intervals between 1976 and 2002.
Whites included approximately 25% Hispanics, whereas other race was predominantly (88%) Asian. Source: Surveillance, Epidemiology, and End Results (SEER) Program (http://www.seer.cancer.gov) SEER*Stat Database: Incidence-SEER 13 Regs Public-Use, Nov 2004 Sub (1973-2002 varying), National Cancer Institute, DCCPS, Surveillance Research Program, Cancer Statistics Branch, released April 2005, based on the November 2004 submission. Reprinted from El-Serag HB, Rudolph KL. Hepatocellular carcinoma: epidemiology and molecular carcinogenesis. Gastroenterology 2007; 132: 2557-2576, Copyright (2007), with permission from Elsevier[1].
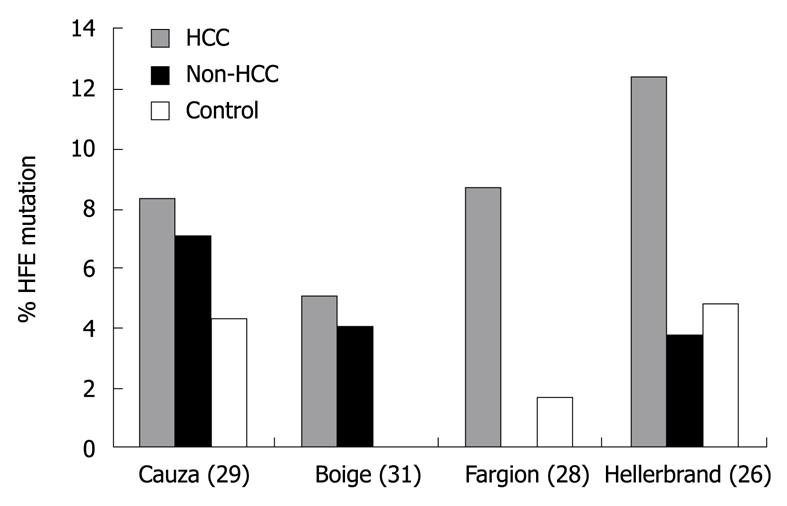
Figure 2 Prevalence of HFE mutations among patients with hepatocellular carcinoma, cirrhosis without hepatocellular carcinoma (non-hepatocellular carcinoma), and normal controls.
Reprinted from Kowdley KV. Iron, hemochromatosis, and hepatocellular carcinoma. Gastroenterology 2004; 127: S79-S86, Copyright (2004), with permission from Elsevier [24]. HCC: Hepatocellular carcinoma.
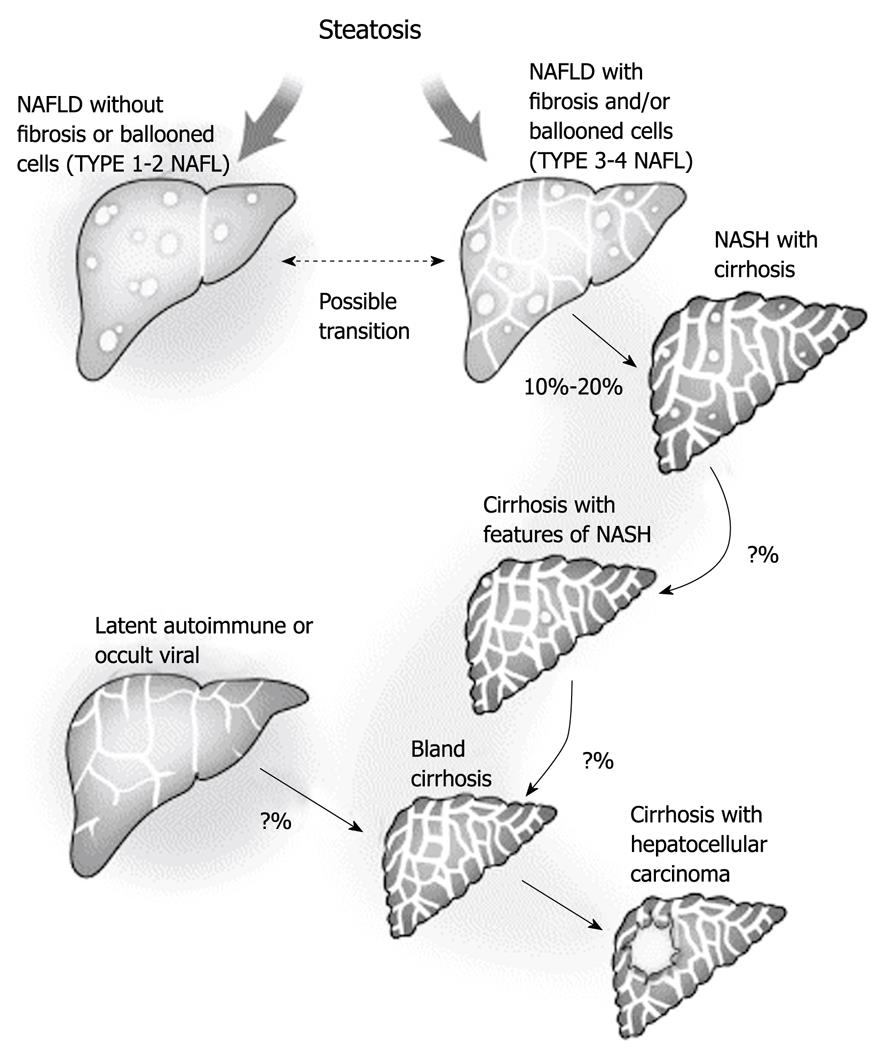
Figure 3 Progression of non-alcoholic fatty liver disease to cryptogenic cirrhosis.
The explanation for the disappearance of steatosis remains uncertain but it is likely to be multifactorial and to involve changes in blood flow and exposure to fat-promoting hormones, as well as possible changes in the intracellular metabolism as a result of long-standing exposure to lipid peroxidation. Theoretically, this could represent a form of lipoatrophy that occurs within the fat-storing hepatocytes. Other forms of chronic liver disease may also present with a well-established bland cirrhosis. Efforts are needed to define better residual markers of past silent disease to improve our understanding of cryptogenic cirrhosis. Reprinted from Caldwell SH, Crespo DM. The spectrum expanded: cryptogenic cirrhosis and the natural history of non-alcoholic fatty liver disease. J Hepatol 2004; 40: 578-584, Copyright (2004), with permission from Elsevier[31]. NALFD: Non-alcoholic fatty liver disease; NASH: Non-alcoholic steatohepatitis.
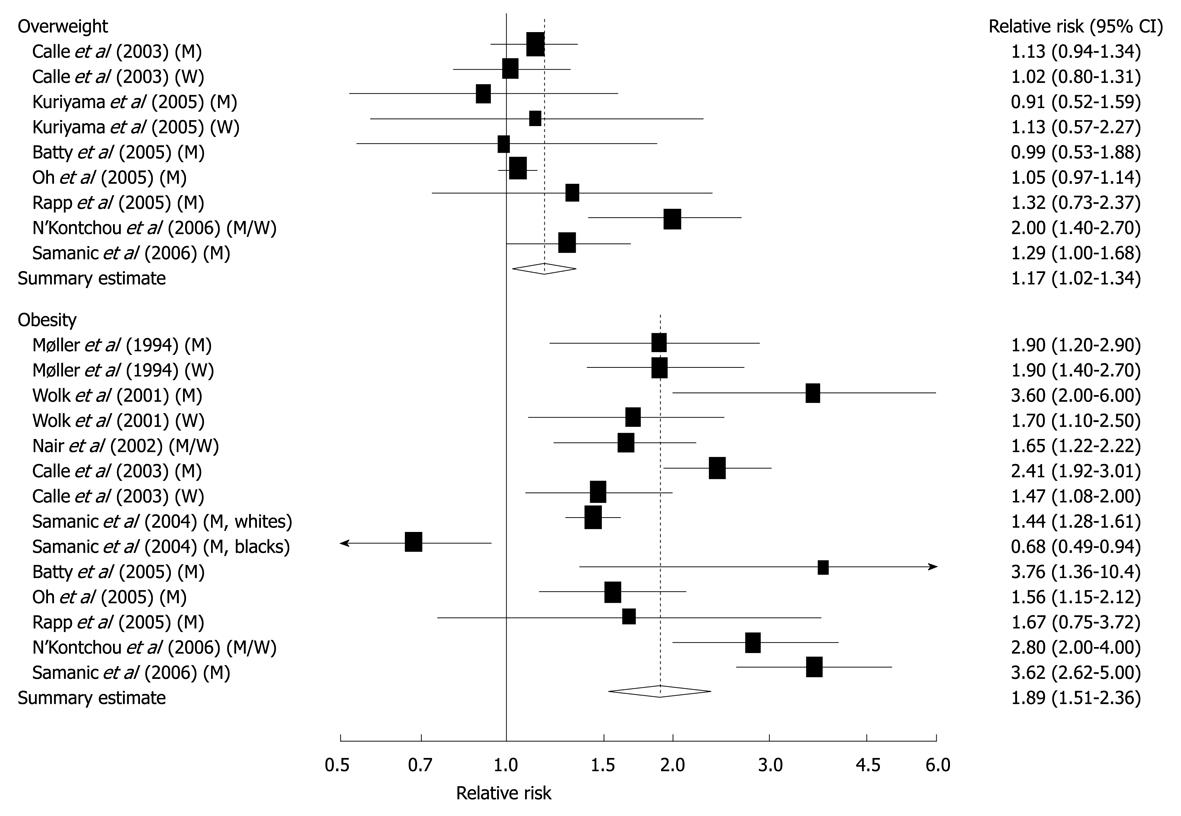
Figure 4 Relative risks of liver cancer associated with overweight and obesity.
Relative risk estimates are for overweight and obese persons compared with normal weight persons. Tests for heterogeneity: overweight, Q = 16.83, P = 0.03, I2 = 52.5%; obesity, Q = 88.03, P < 0.001, I2 = 86.4%. M: Men; W: Women[42]. Reprinted by permission from Macmillan Publishers Ltd: [Br J Cancer]. Larsson SC, Wolk A. Overweight, obesity and risk of liver cancer: a meta-analysis of cohort studies. Br J Cancer 2007; 97: 1005-1008, copyright (2007)[42].
Figure 5 Unadjusted ORs and 95% CIs for the association between diabetes and hepatocellular carcinoma in 13 case-control studies.
1Population-based control groups; 2Hospital-based control groups. Black diamonds indicate weighted average of all studies; Black boxes indicate point estimates for ORs[47] Reprinted with El-Serag HB, Hampel H, Javadi F. The association between diabetes and hepatocellular carcinoma: a systematic review of epidemiologic evidence. Clin Gastroenterol Hepatol 2006; 4: 369-380, Copyright (2006), with permission from Elsevier[47].
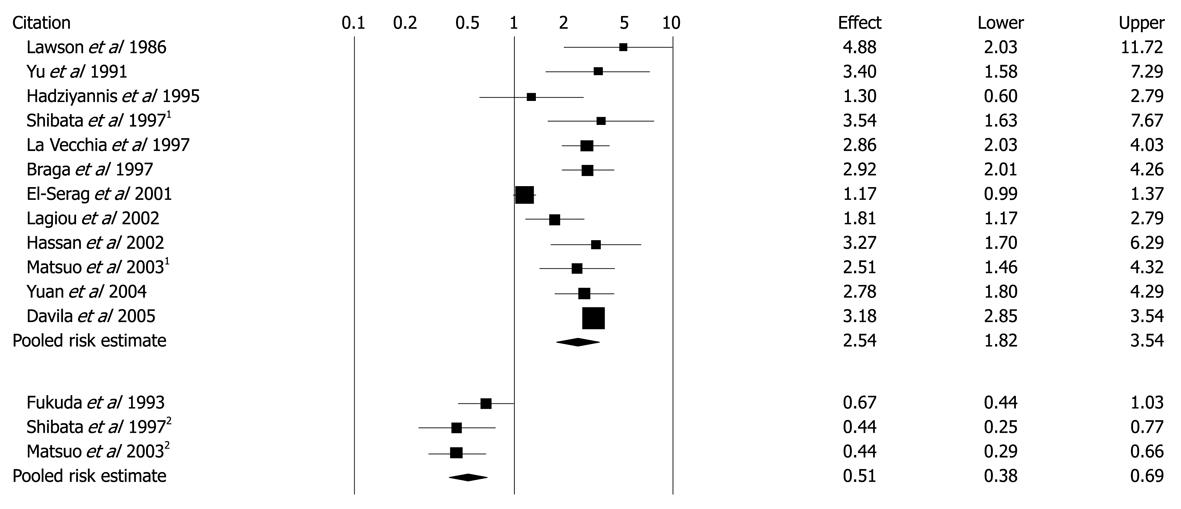
Figure 6 Unadjusted risk ratios and 95% CIs for the association between diabetes and hepatocellular carcinoma in 12 cohort studies.
Black diamond indicates weighted average of all studies; Black boxes indicate the point estimates for risk ratios[47]. Reprinted from El-Serag HB, Hampel H, Javadi F. The association between diabetes and hepatocellular carcinoma: a systematic review of epidemiologic evidence. Clin Gastroenterol Hepatol 2006; 4: 369-380, Copyright (2006), with permission from Elsevier[47].
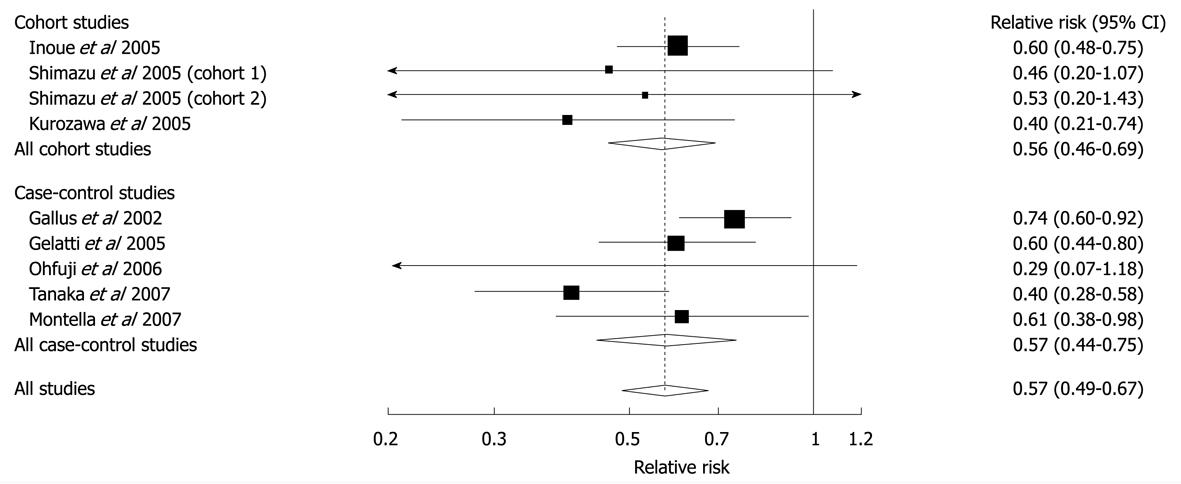
Figure 7 Relative risks of liver cancer associated with coffee consumption (per 2 cups/d increment).
Squares represent study-specific relative risk estimates (size of the square reflects the study-specific statistical weight, that is, the inverse of the variance); horizontal lines represent 95% CIs; diamonds represent summary relative risk estimates with corresponding 95% CIs. Tests for heterogeneity: all studies, Q = 11.56, P = 0.17, I2 = 30.8%; cohort studies, Q = 1.74, P = 0.63, I2 = 0%; case-control studies, Q = 9.28, P = 0.05, I2 = 36.9%. Reprinted from Larsson SC, Wolk A. Coffee consumption and risk of liver cancer: a meta-analysis. Gastroenterology 2007; 132: 1740-1745, Copyright (2007), with permission from Elsevier[66].
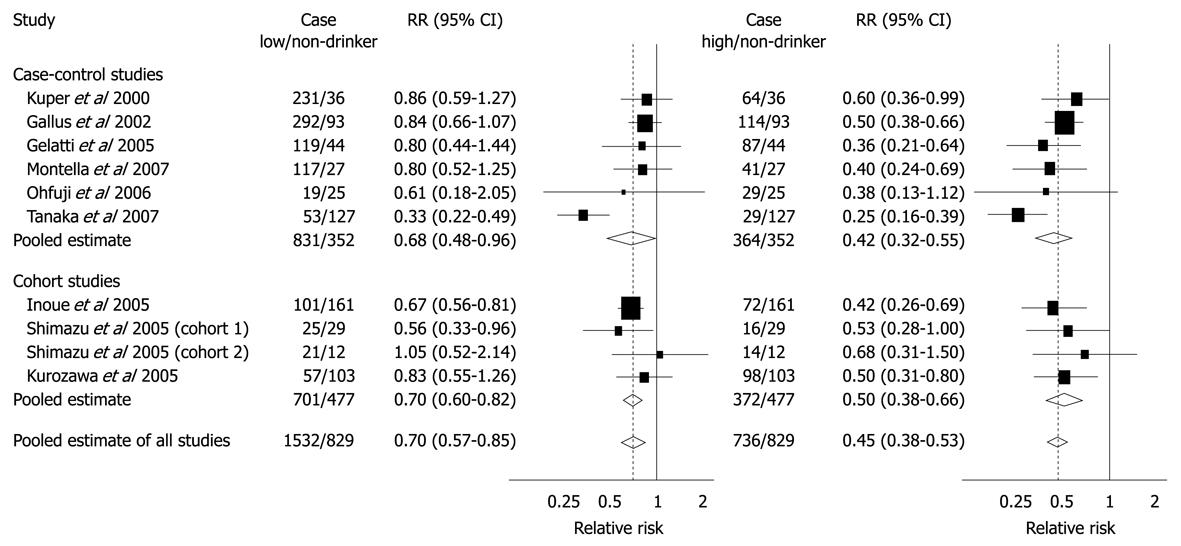
Figure 8 Summary RRs of hepatocellular carcinoma for low or moderate and high coffee drinkers vs non-drinkers from case-control and cohort studies.
Low or moderate consumption was defined as < 3 cups per day for Gallus et al, Gelatti et al, Inoue et al and Montella et al and as < 1 cup per day for Ohfuji et al, Tanaka et al, Kurozawa et al, and Shimazu et al; High consumption was defined as ≥ 3 cups per day for Gallus et al, Gelatti et al, Inoue et al, and Montella et al and as ≥ 1 cup per day for Ohfuji et al, Tanaka et al, Kurozawa et al, and Shimazu et al. Bravi F, Bosetti C, Tavani A, Bagnardi V, Gallus S, Negri E, Franceschi S, La Vecchia C. Coffee drinking and hepatocellular carcinoma risk: a meta-analysis. Hepatology 2007; 46: 430-435[67]. Copyright 2007, John Wiley & Sons, Inc. Reproduced with permission of John Wiley & Sons, Inc.
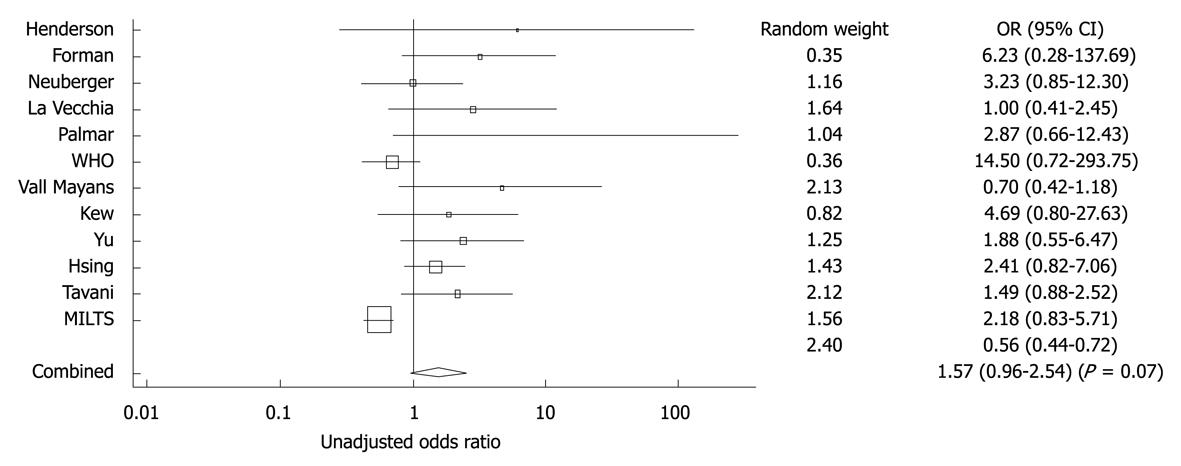
Figure 9 Forest plot showing adjusted OR and 95% CI for the association between oral contraceptive and hepatocellular carcinoma for the eight studies that included adjusted ORs.
The diamond symbol indicates the weighted random pooled OR of all studies included in the analysis. Reprinted from Maheshwari S, Sarraj A, Kramer J, El-Serag HB. Oral contraception and the risk of hepatocellular carcinoma. J Hepatol 2007; 47: 506-513, Copyright (2007), with permission from Elsevier[95].
- Citation: Blonski W, Kotlyar DS, Forde KA. Non-viral causes of hepatocellular carcinoma. World J Gastroenterol 2010; 16(29): 3603-3615
- URL: https://www.wjgnet.com/1007-9327/full/v16/i29/3603.htm
- DOI: https://dx.doi.org/10.3748/wjg.v16.i29.3603


