Copyright
©2010 Baishideng.
World J Gastroenterol. Jul 14, 2010; 16(26): 3258-3266
Published online Jul 14, 2010. doi: 10.3748/wjg.v16.i26.3258
Published online Jul 14, 2010. doi: 10.3748/wjg.v16.i26.3258
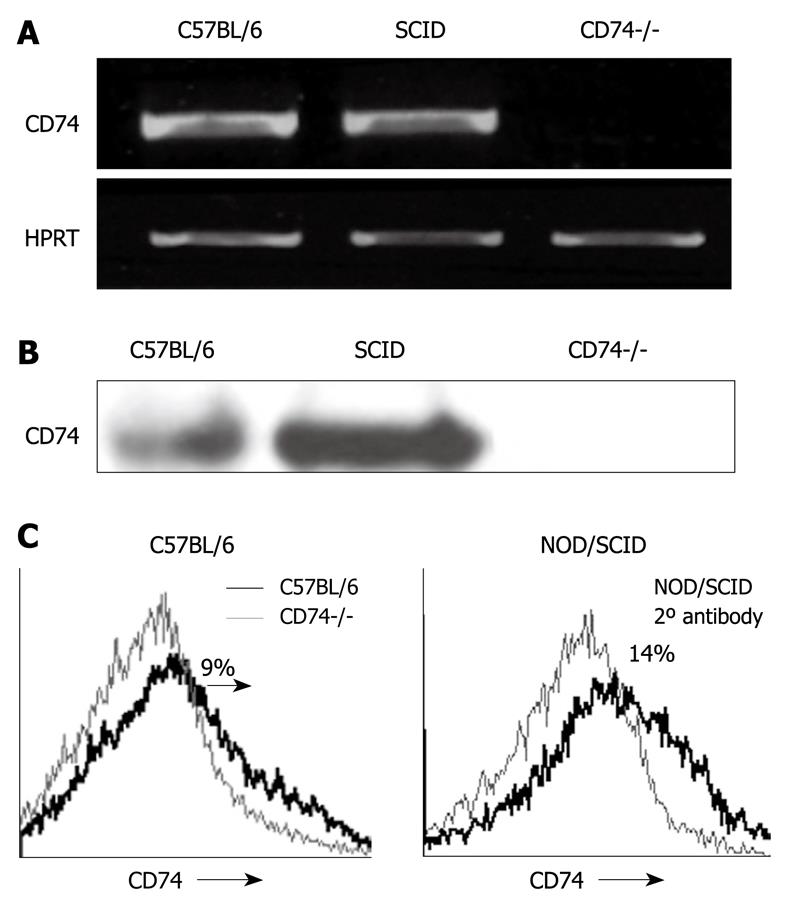
Figure 1 CD74 is expressed on naive CEC isolated from C57BL/6 mice.
CEC were isolated from C57BL/6, NOD/SCID and CD74-/- mice. A: RNA was purified and CD74 or HPRT mRNA were analyzed by RT-PCR. The results presented are representative of four separate experiments; B: Cells were lysed and proteins were analyzed by Western blotting; C: Cells were stained with anti cytokeratin and anti CD74 antibodies, and analyzed by FACS. Histograms show CD74 expression on cytokeratin positive cells. CEC: Colon epithelial cells; RT-PCR: Reverse transcriptase-polymerase chain reaction; FACS: Fluorescence-activated cell sorter.
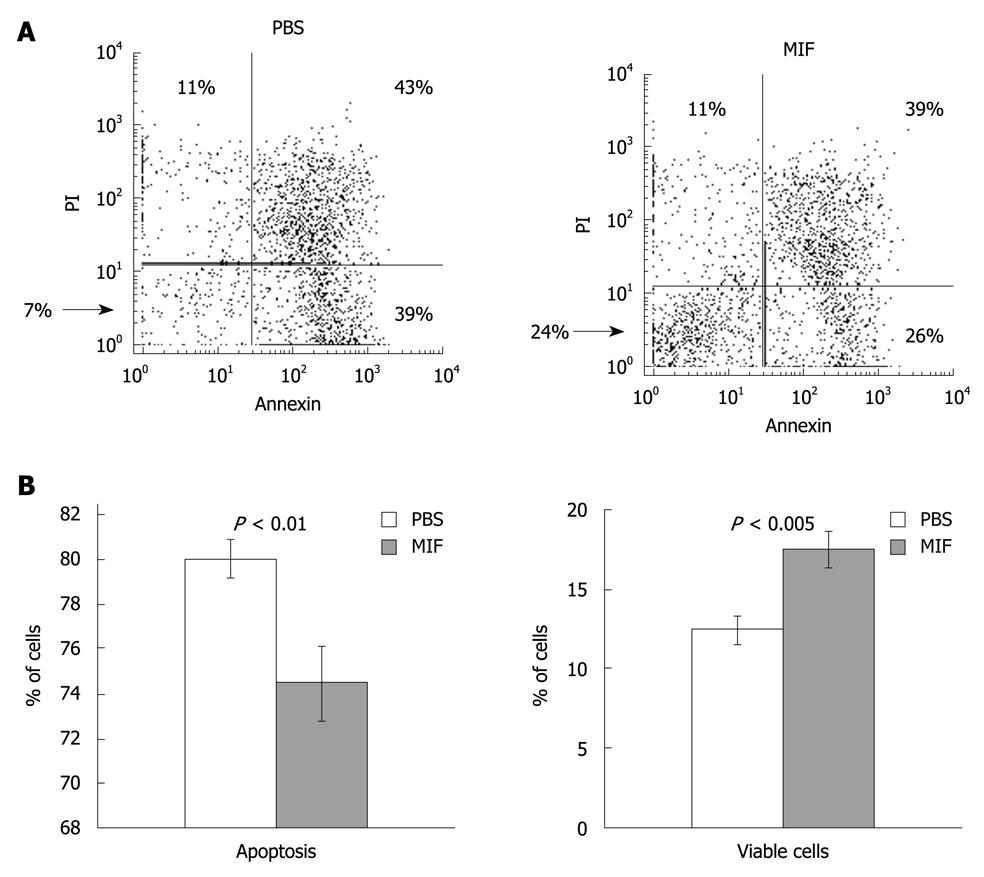
Figure 2 In vitro stimulation with MIF induces CEC survival.
CEC from C57BL/6 mice were incubated in the presence or absence of MIF (400 ng/mL). A: After 17 h, cells were collected and analyzed for survival by annexin and propidium iodide staining; B: Graphs summarizing the results of four independent experiments. MIF: Migration inhibitory factor; PBS: Phosphate buffered saline.
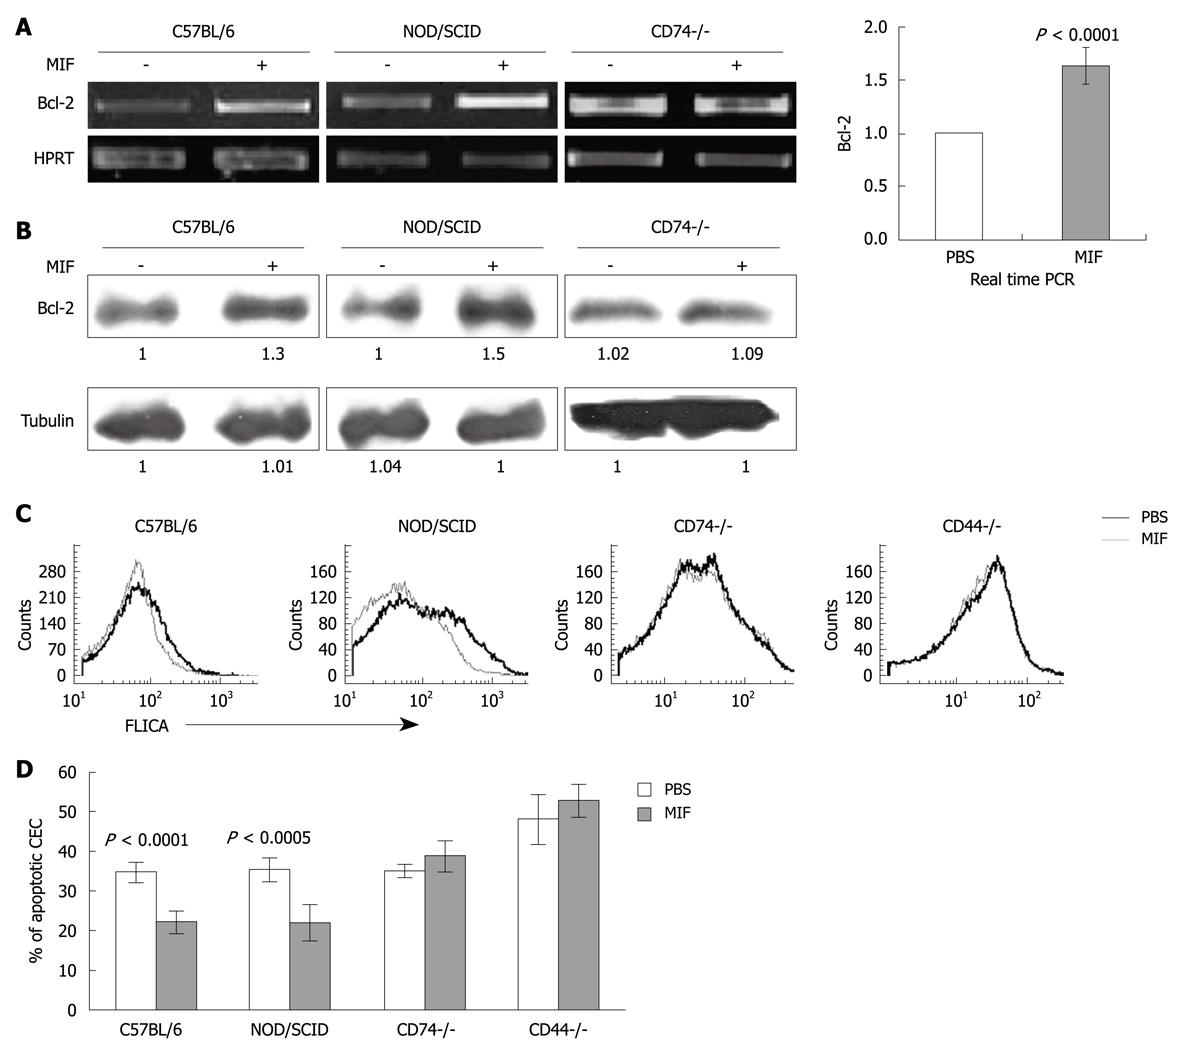
Figure 3 MIF stimulation elevates Bcl-2 and survival in CEC and their in vivo.
CEC were isolated from CD74-/-, C57BL/6 and from NOD/SCID mice that were i.p injected with MIF (400 ng) or PBS 3.5 h before sacrifice. A: CEC were isolated, and RNA was purified; Bcl-2 or HPRT mRNA were analyzed by RT-PCR. The results presented are representative of four different experiments. The graph is a summary of four separate experiments of quantitative real time PCR using primers for Bcl-2 in CEC isolated from C57BL/6; B: Cells were lysed and Bcl-2 protein expression was analyzed by Western blotting analysis; C, D: C57BL/6, NOD/SCID, CD44-/- and CD74-/- mice were injected with MIF (400 ng) or PBS. After 24 h, mice were sacrificed and their CEC were isolated and stained with FLICA. C: Histograms show FLICA staining in MIF injected (grey line) compared to PBS injected (black line) CEC; D: Graph representing the average of five different experiments, demonstrating decreased apoptosis CEC in MIF treated C57BL/6 and NOD/SCID mice, compared to PBS treated animals.
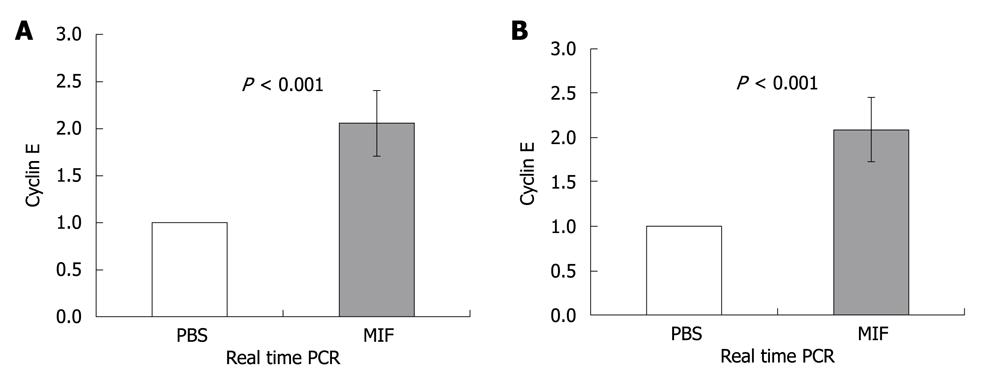
Figure 4 MIF induces cyclin E expression.
CEC were isolated from C57BL/6 (A) and NOD/SCID (B) mice that were i.p injected with MIF (400 ng) or PBS 3.5 h prior to isolation of CEC. A, B: Quantitative real time PCR was performed using primers for cyclin E and β-actin. β-actin levels were used to normalize samples for calculation of the relative expression levels of cyclin E. Results are expressed as a fold of change in cyclin E expression at stimulated cells compared to non stimulated cells, which was defined as 1. Results shown are summary of four separate experiments.
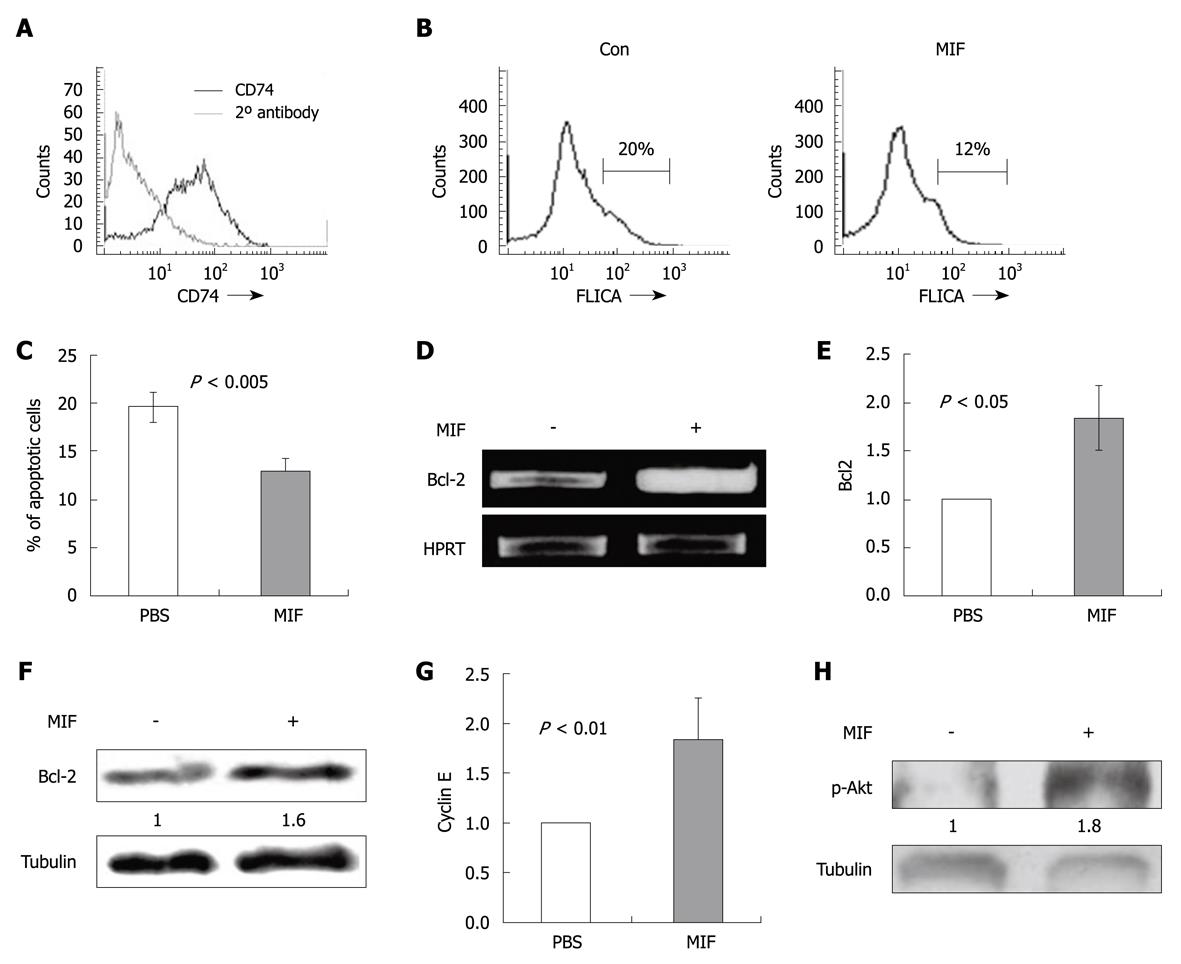
Figure 5 CD74 is expressed on CT26 cells and regulates their survival.
A: CT26 cells were stained with anti CD74 antibodies, and analyzed by FACS. Histogram shows CD74 expression on these cells; B: Serum-starved CT26 cells were incubated in the presence or absence of MIF (400 ng/mL) for 6 h. Histograms show FLICA staining for apoptotic cells in both groups; C: Graph representing the average of five different experiments, demonstrating decreased apoptosis in MIF treated compared to untreated CT26 cell line; D: Serum-starved CT26 cells were either kept untreated or treated with MIF (400 ng/mL) for 3 h and levels of Bcl-2 mRNA were analyzed by RT-PCR. The results presented are representative of five different experiments; E: Quantitative real time PCR was performed using primers for Bcl-2. β-actin levels were used to normalize samples for calculation of the relative expression of Bcl2 level. Results are expressed as a fold of change in Bcl-2 expression at stimulated cells compared to non stimulated cells, which was defined as 1. Results shown are a summary of four separate experiments; F: Following 6 h of starvation the CT26 cells were lysed and Bcl-2 protein expression was analyzed by Western blotting analysis; G: Quantitative real time PCR was performed using primers for cyclin E and β-actin. β-actin levels were used to normalize samples for calculation of the relative expression levels of cyclin E. Results are expressed as a fold of change in cyclin E expression at stimulated cells compared to non stimulated cells, which was defined as 1. Results shown are a summary of four separate experiments; H: CT26 cells were incubated in the presence or absence of MIF (400 ng/mL) for 1 min. Cells were fast-frozen and lysed as described in Methods. Lysates were separated on 10% (wt/vol) SDS/PAGE and blotted with anti-p-Akt antibody (results presented are representative of three separate experiments) followed by HRP-conjugated anti-mouse antibodies. The membranes were then stripped and blotted with anti-tubulin.
- Citation: Maharshak N, Cohen S, Lantner F, Hart G, Leng L, Bucala R, Shachar I. CD74 is a survival receptor on colon epithelial cells. World J Gastroenterol 2010; 16(26): 3258-3266
- URL: https://www.wjgnet.com/1007-9327/full/v16/i26/3258.htm
- DOI: https://dx.doi.org/10.3748/wjg.v16.i26.3258


