Copyright
©2010 Baishideng.
World J Gastroenterol. Jun 7, 2010; 16(21): 2579-2588
Published online Jun 7, 2010. doi: 10.3748/wjg.v16.i21.2579
Published online Jun 7, 2010. doi: 10.3748/wjg.v16.i21.2579
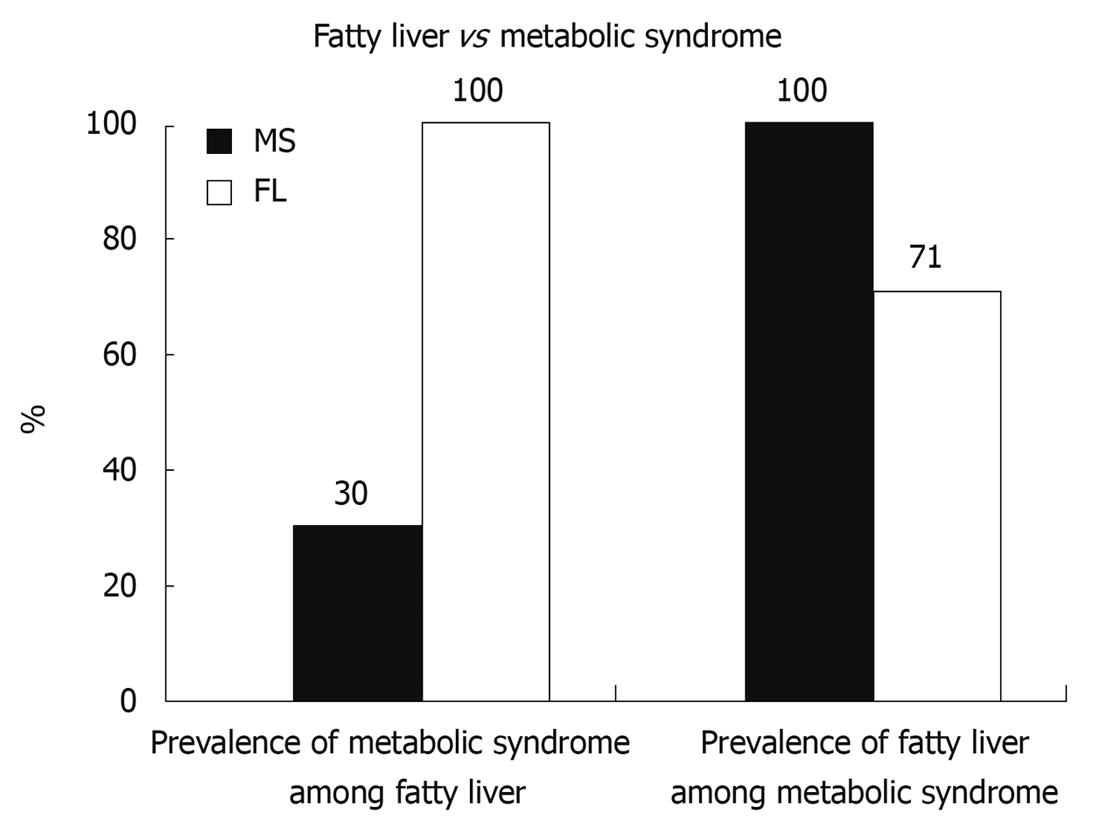
Figure 1 Prevalence of fatty liver among metabolic syndrome and prevalence of metabolic syndrome among fatty liver.
MS: Metabolic syndrome; FL: Fatty liver. Alberti, Circulation (2009). P < 0.001.
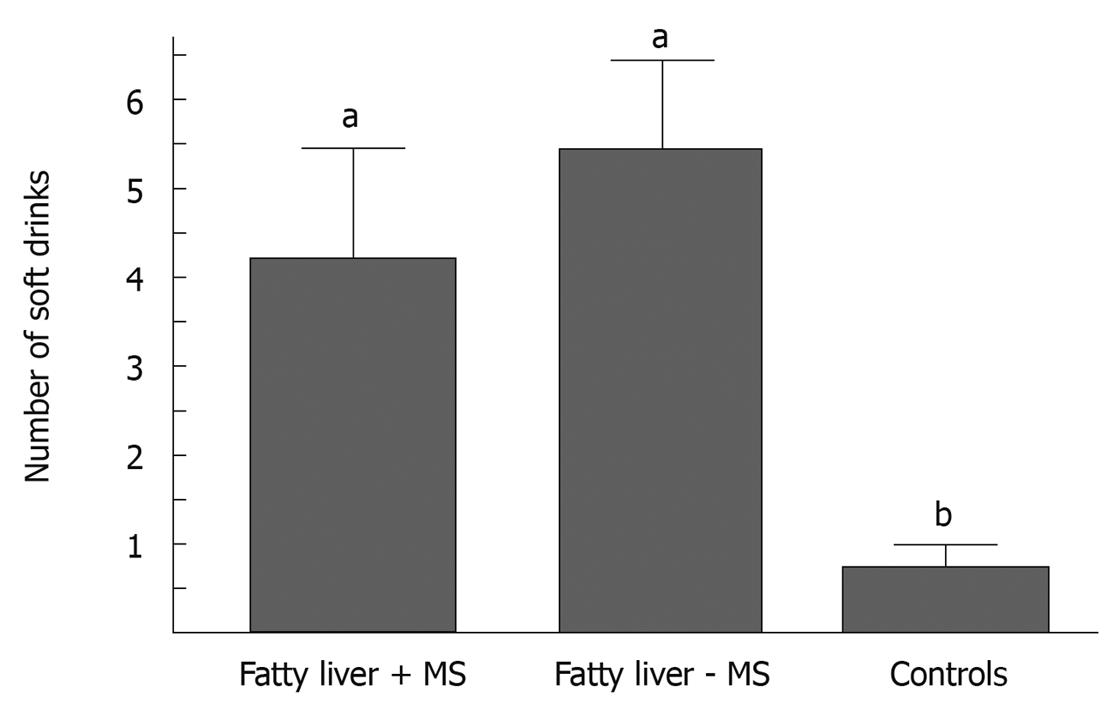
Figure 2 Daily amount of soft drinks consumption in nonalcoholic fatty liver disease (NAFLD) patients with (n = 31) or without metabolic syndrome (n = 29) and in controls (n = 30).
aP < 0.07; fatty liver without metabolic syndrome vs fatty liver with metabolic syndrome, bP < 0.001 between fatty liver subgroups and controls[14,15].
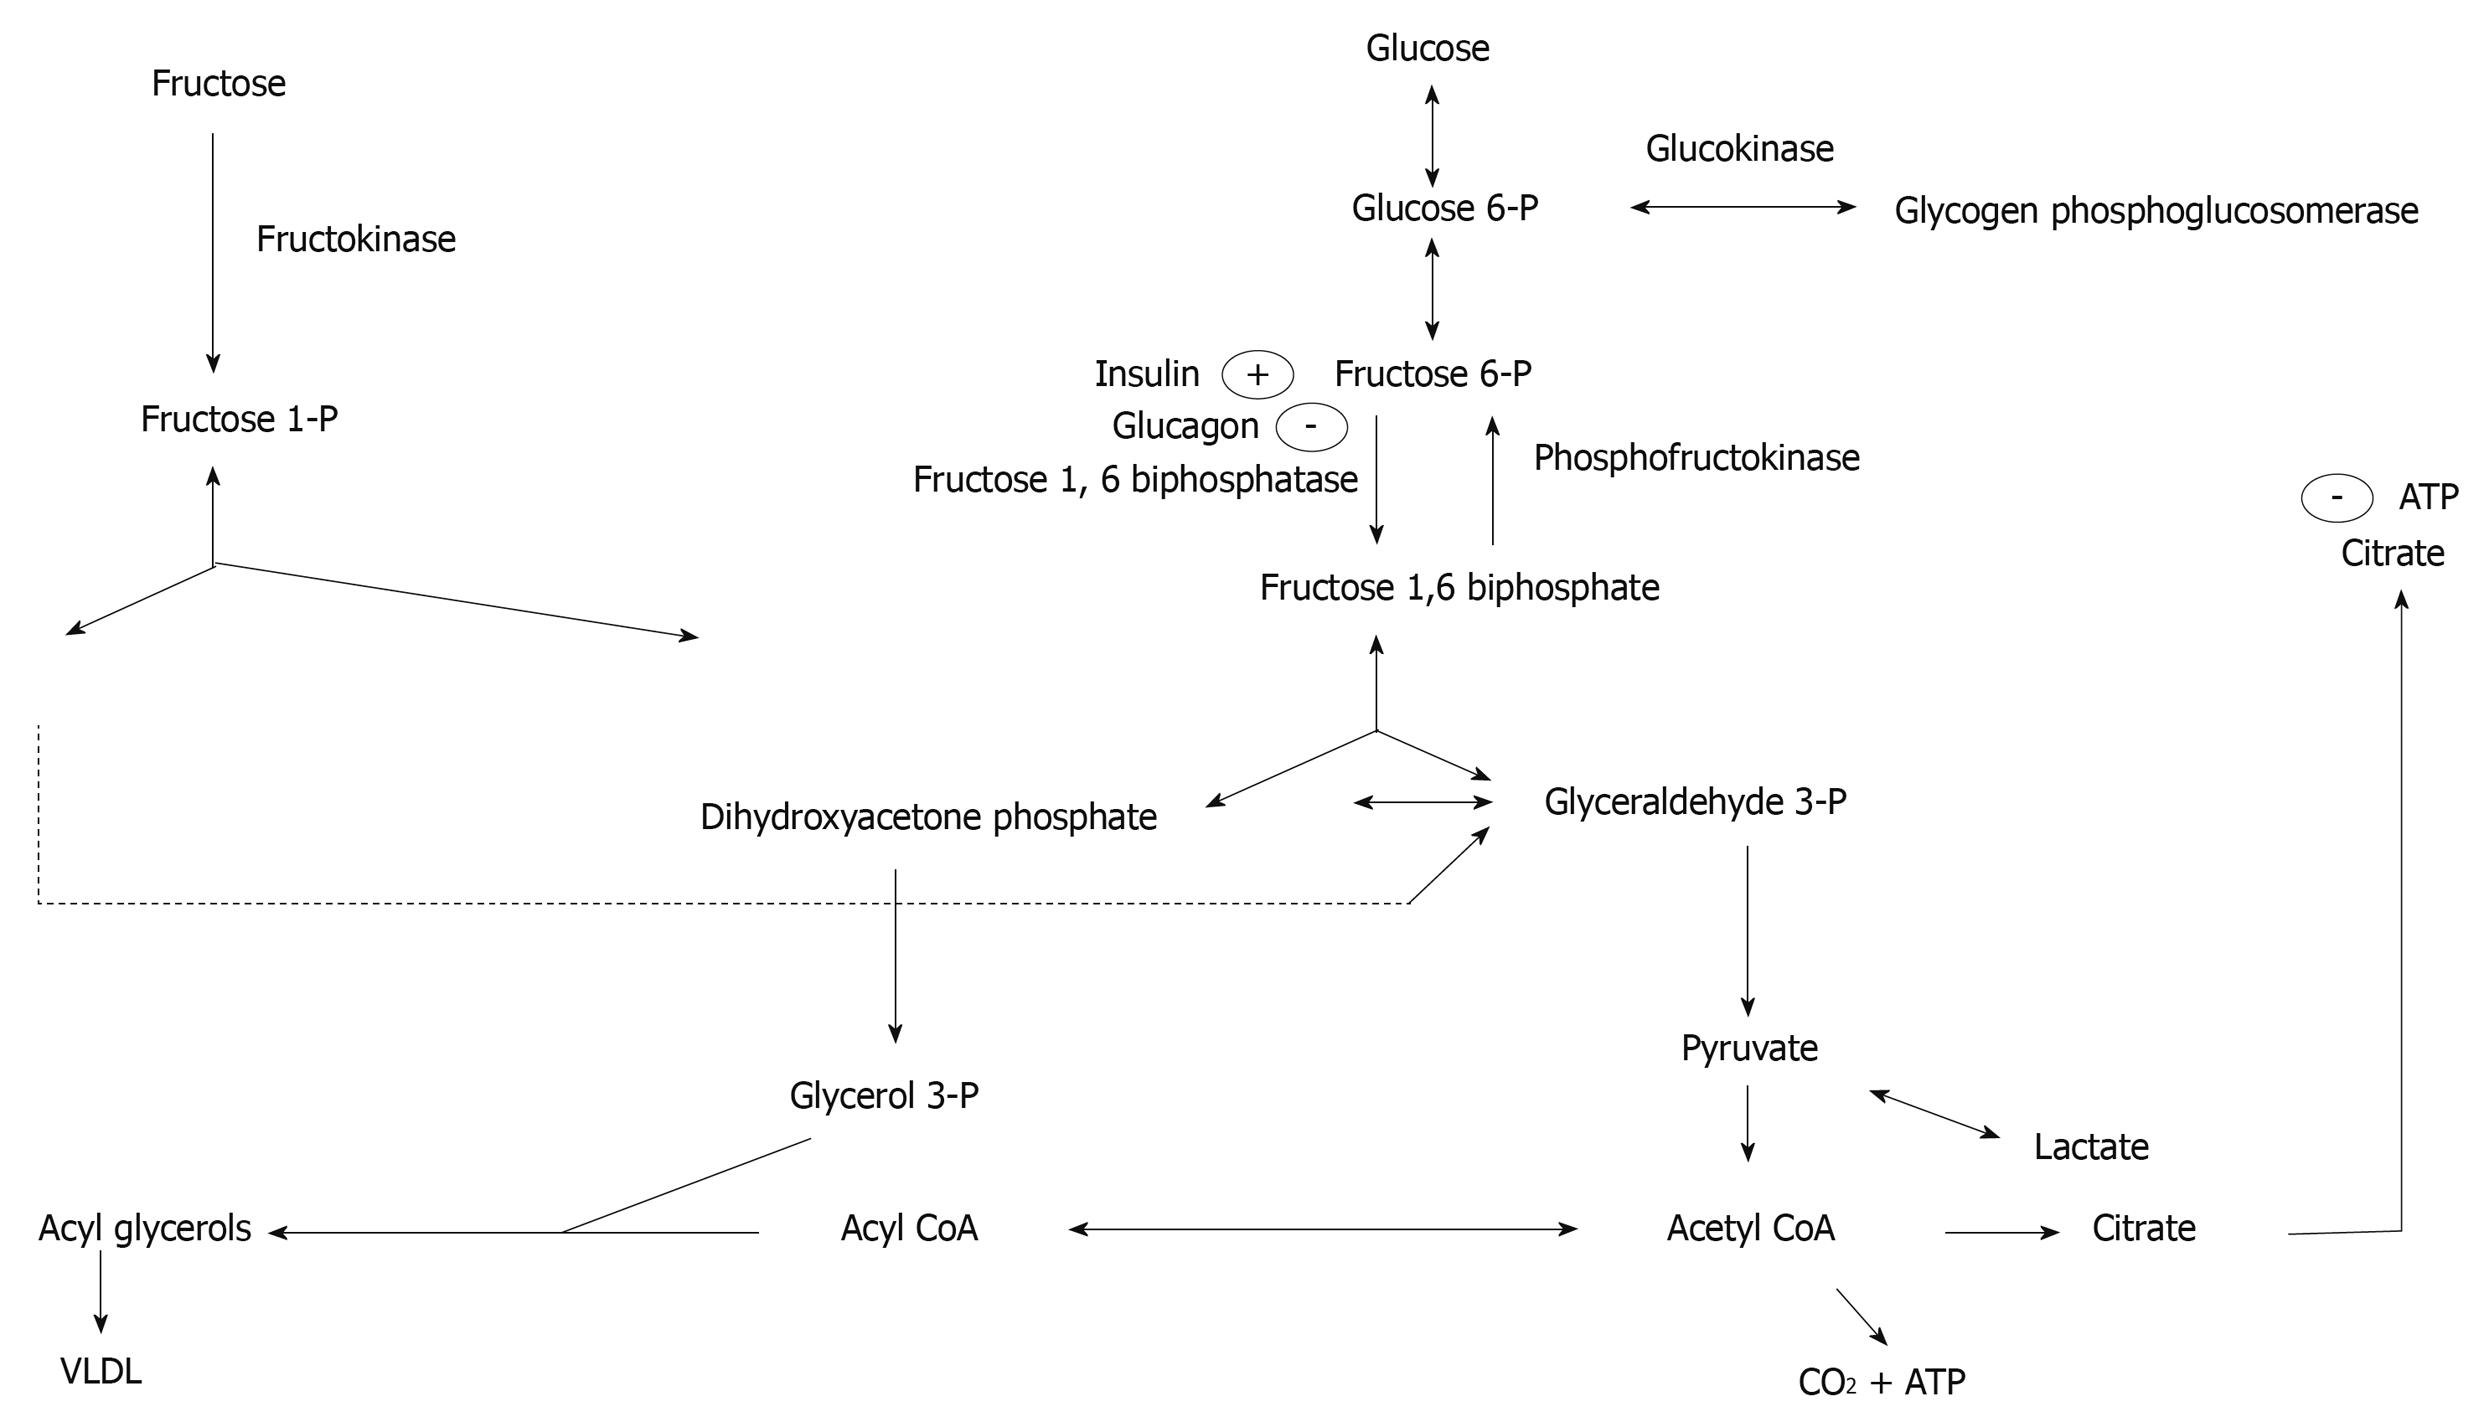
Figure 3 Fructose metabolism in the liver.
Hepatic fructose metabolism begins with phosphorylation of fructokinase. Fructose carbon enters the glycolytic pathway at the triose phosphate level. Thus, fructose bypasses the major control point by which glucose carbon enters glycolysis. This allows fructose to serve as an unregulated source of glycerol-3-phosphate and acetyl-CoA for hepatic lipogenesis.
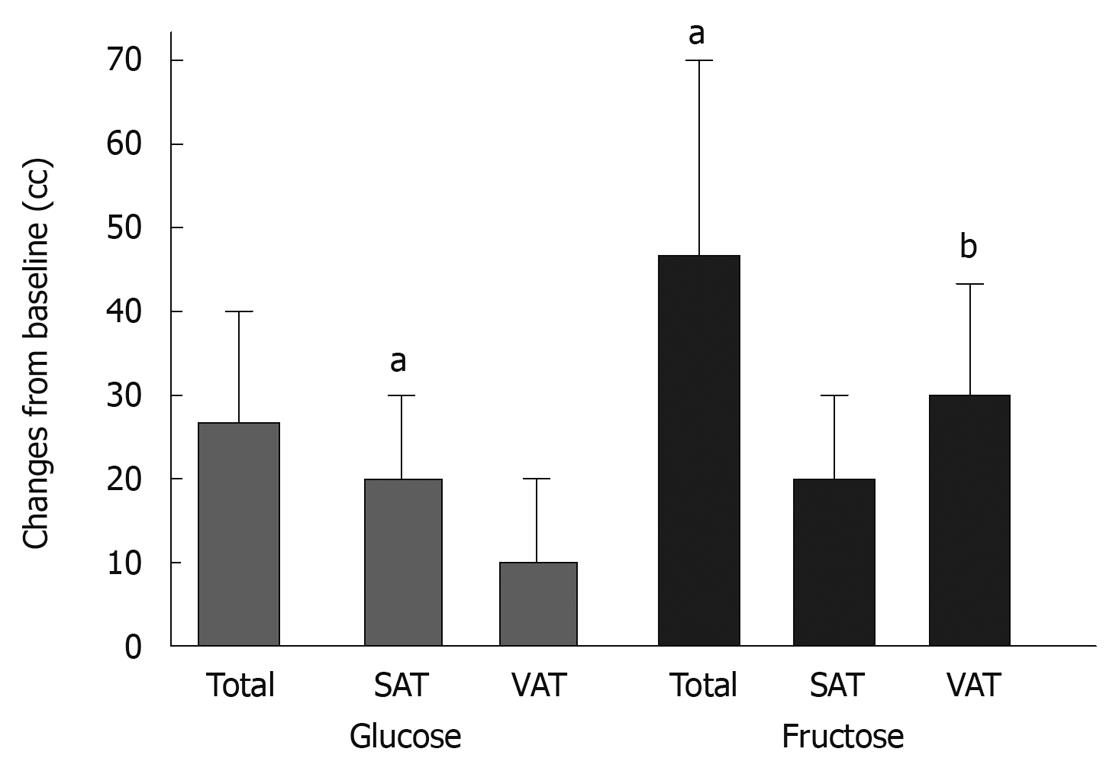
Figure 4 Changes in total abdominal adipose tissue, superficial adipose tissues (SAT), and visceral adipose tissue (VAT) volume after consuming glucose- or fructose-sweetened beverages for 10 wk.
aP < 0.05, bP < 0.01, 10 wk vs 0 wk; paired Student’s t test. Glucose, n = 14; Fructose, n = 17. Data represent mean ± SE (Stanhope, J Clin Invest, 2009).
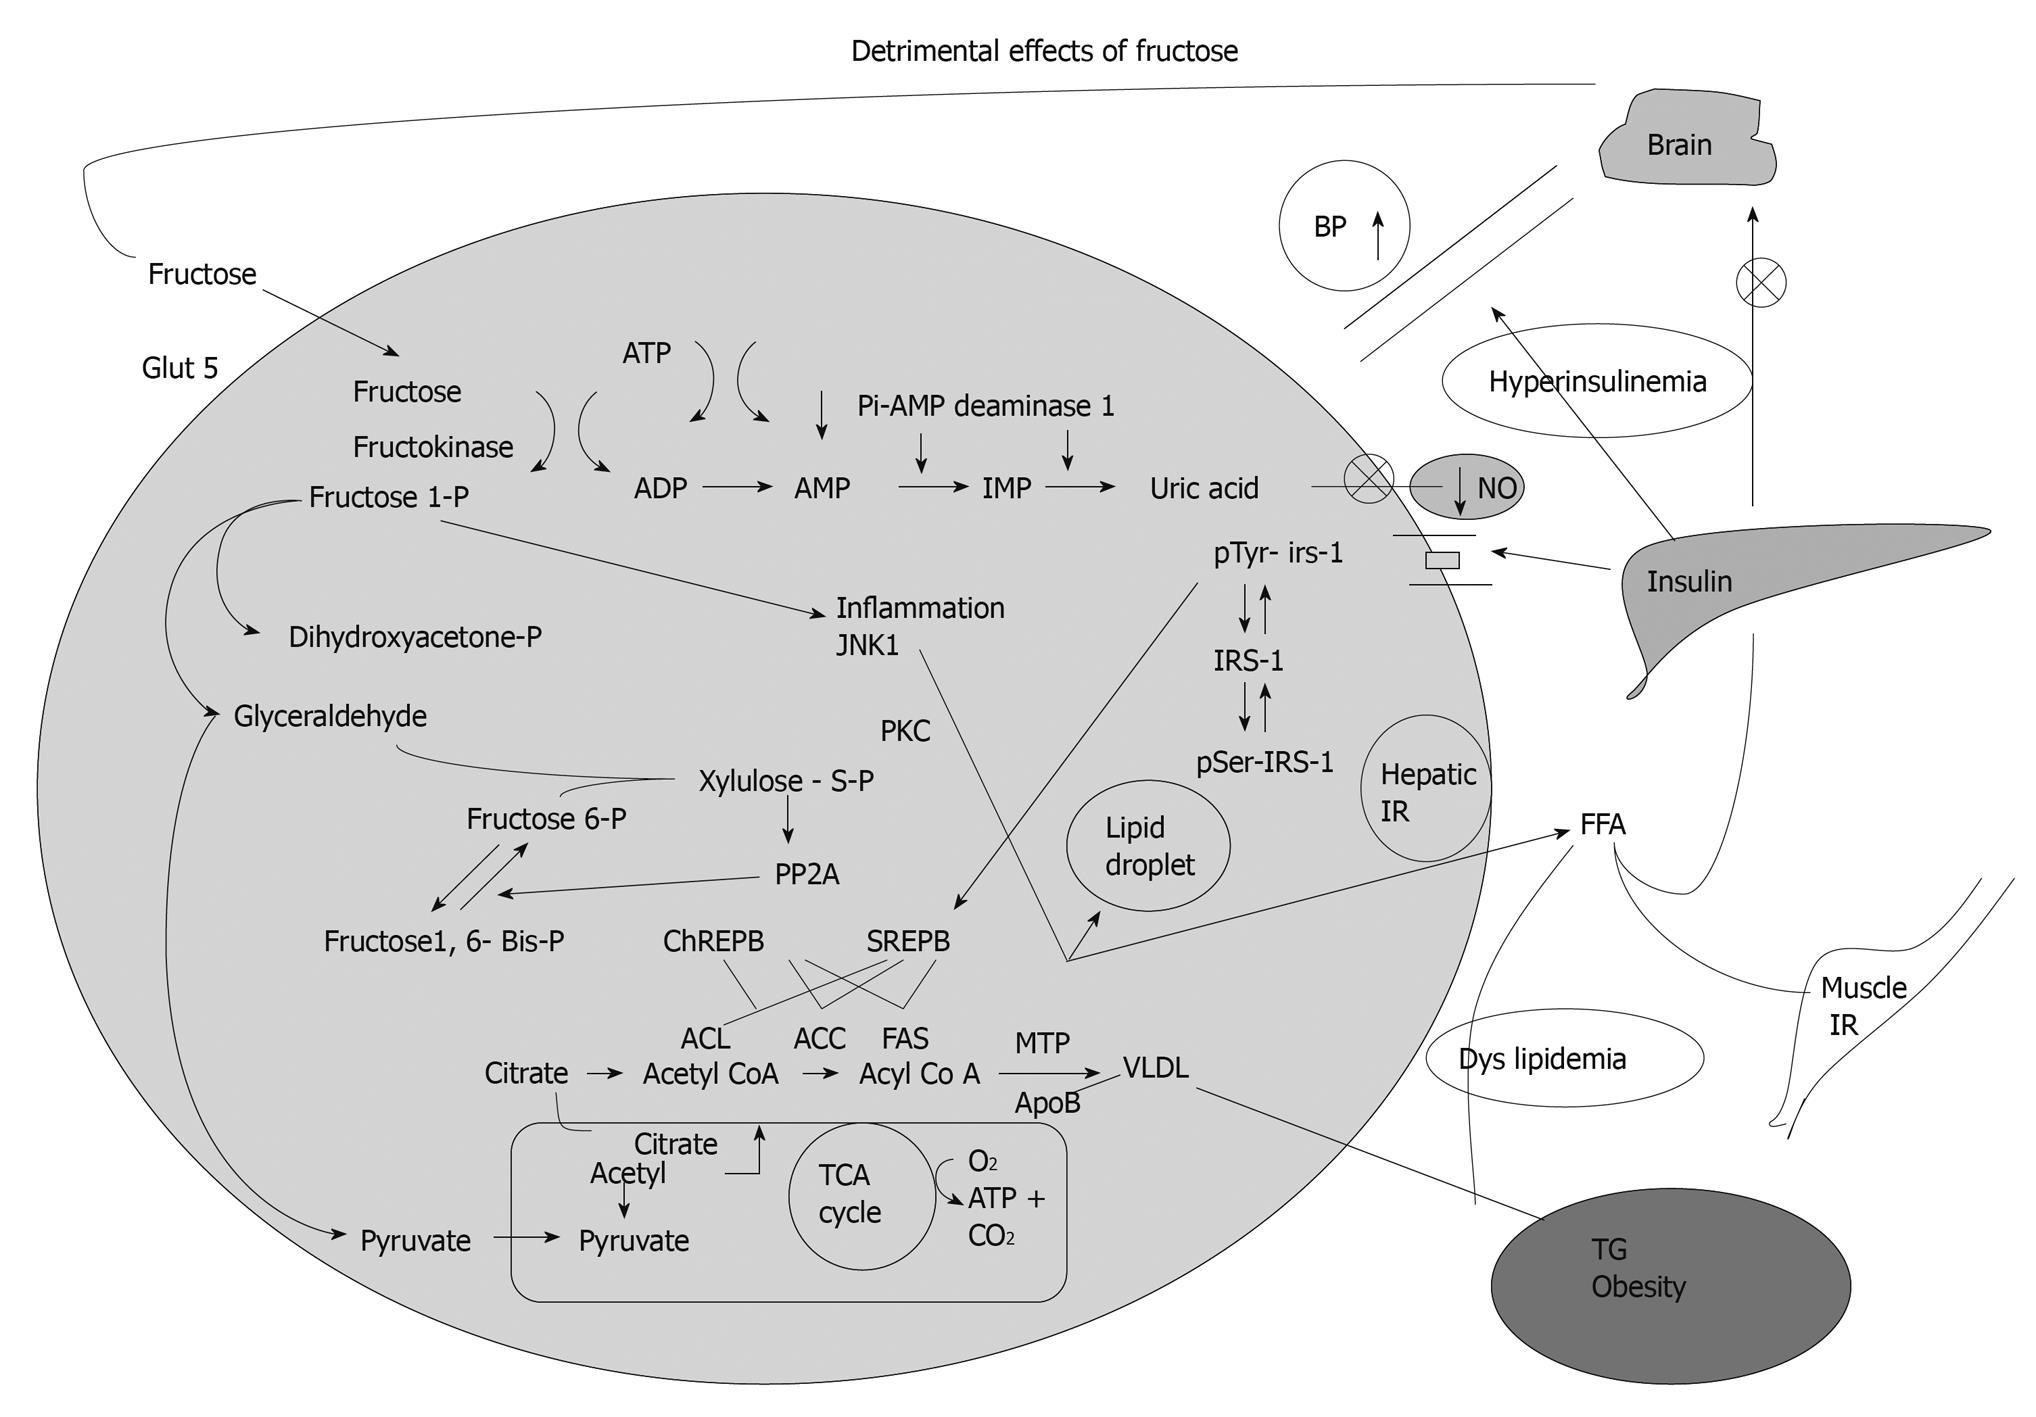
Figure 5 Mechanisms of detrimental effects of fructose.
- Citation: Nseir W, Nassar F, Assy N. Soft drinks consumption and nonalcoholic fatty liver disease. World J Gastroenterol 2010; 16(21): 2579-2588
- URL: https://www.wjgnet.com/1007-9327/full/v16/i21/2579.htm
- DOI: https://dx.doi.org/10.3748/wjg.v16.i21.2579


