Copyright
©2010 Baishideng.
World J Gastroenterol. May 14, 2010; 16(18): 2252-2259
Published online May 14, 2010. doi: 10.3748/wjg.v16.i18.2252
Published online May 14, 2010. doi: 10.3748/wjg.v16.i18.2252
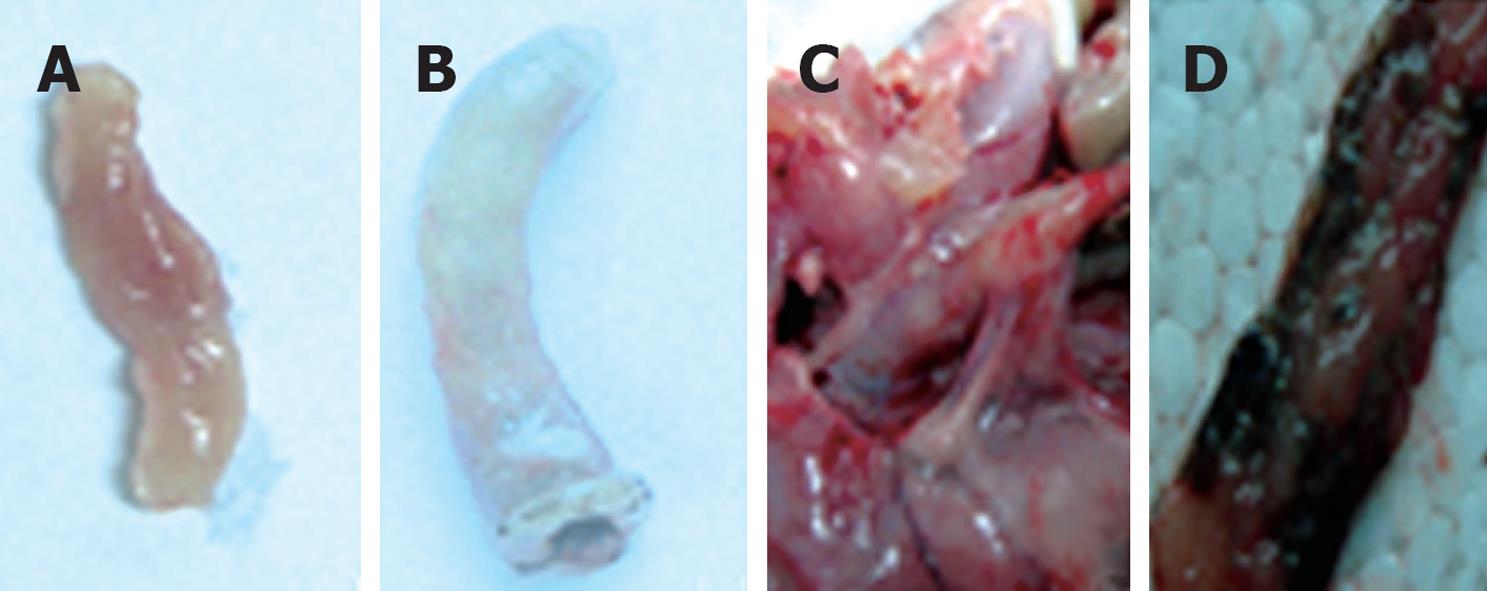
Figure 1 The macroscopic appearance of colon tissue in trinitrobenzene sulfonic acid (TNBS)-treated vs control rats.
A: The colon of control rats, with macroscopic damage score = 0; B-D depict colonic tissue of TNBS-treated rats: B: Significant swelling and distension, with macroscopic damage score = 5; C: Extensive adhesions around the colon, with macroscopic damage score = 7; D: Necrotic foci in colon, with macroscopic damage score = 8.5.
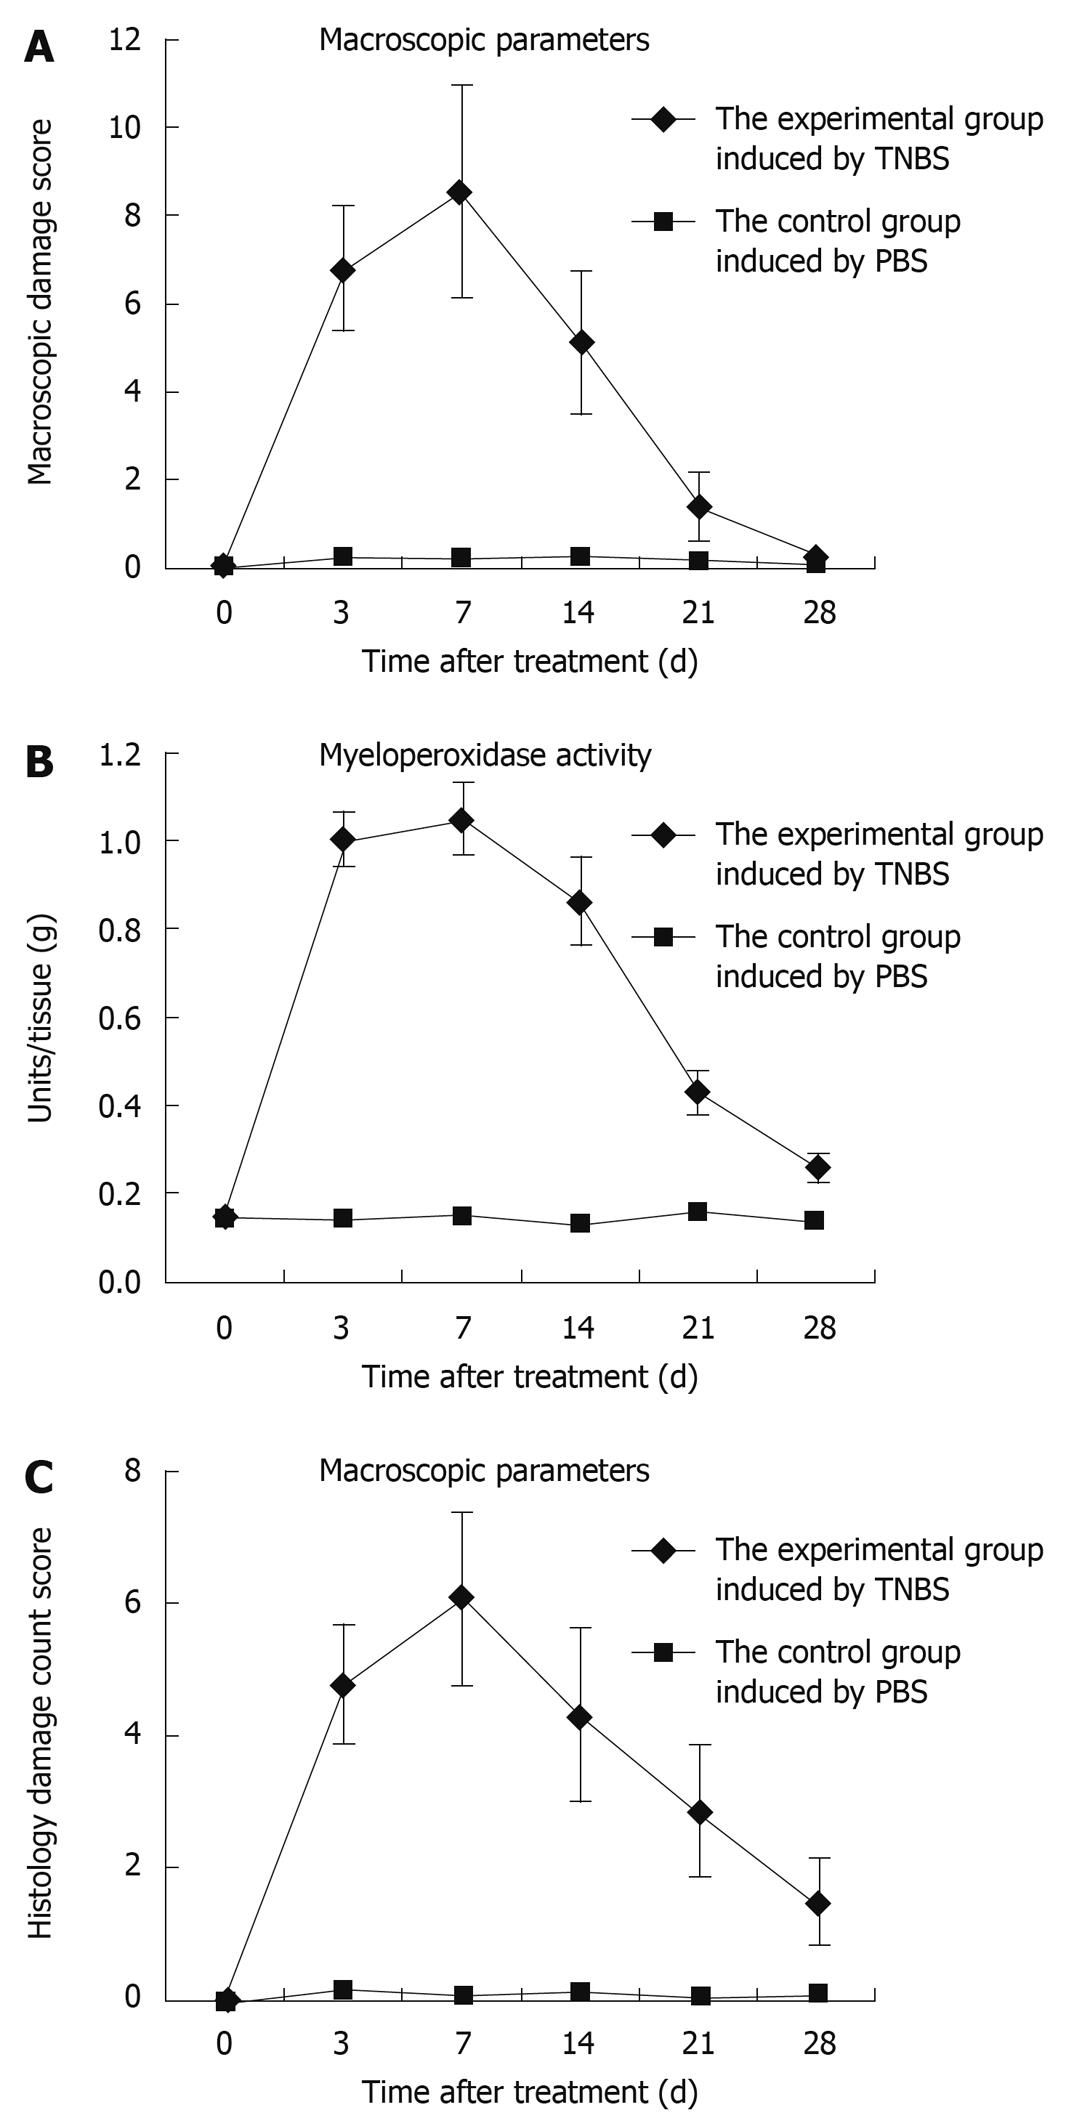
Figure 2 Assessment of TNBS-induced colitis rats by time points.
As these severe inflammatory changes covered 2-4 cm of the distal colonic mucosa, this resulted in a higher median macroscopic damage score in TNBS-treated rats compared to controls (A, P < 0.01), especially by day 7; compared with the control rats, MPO activity increased gradually, peaked by day 7, and decreased to nearly the baseline value (B); The score reached a peak at day 7, and decreased gradually to nearly the normal value (C).
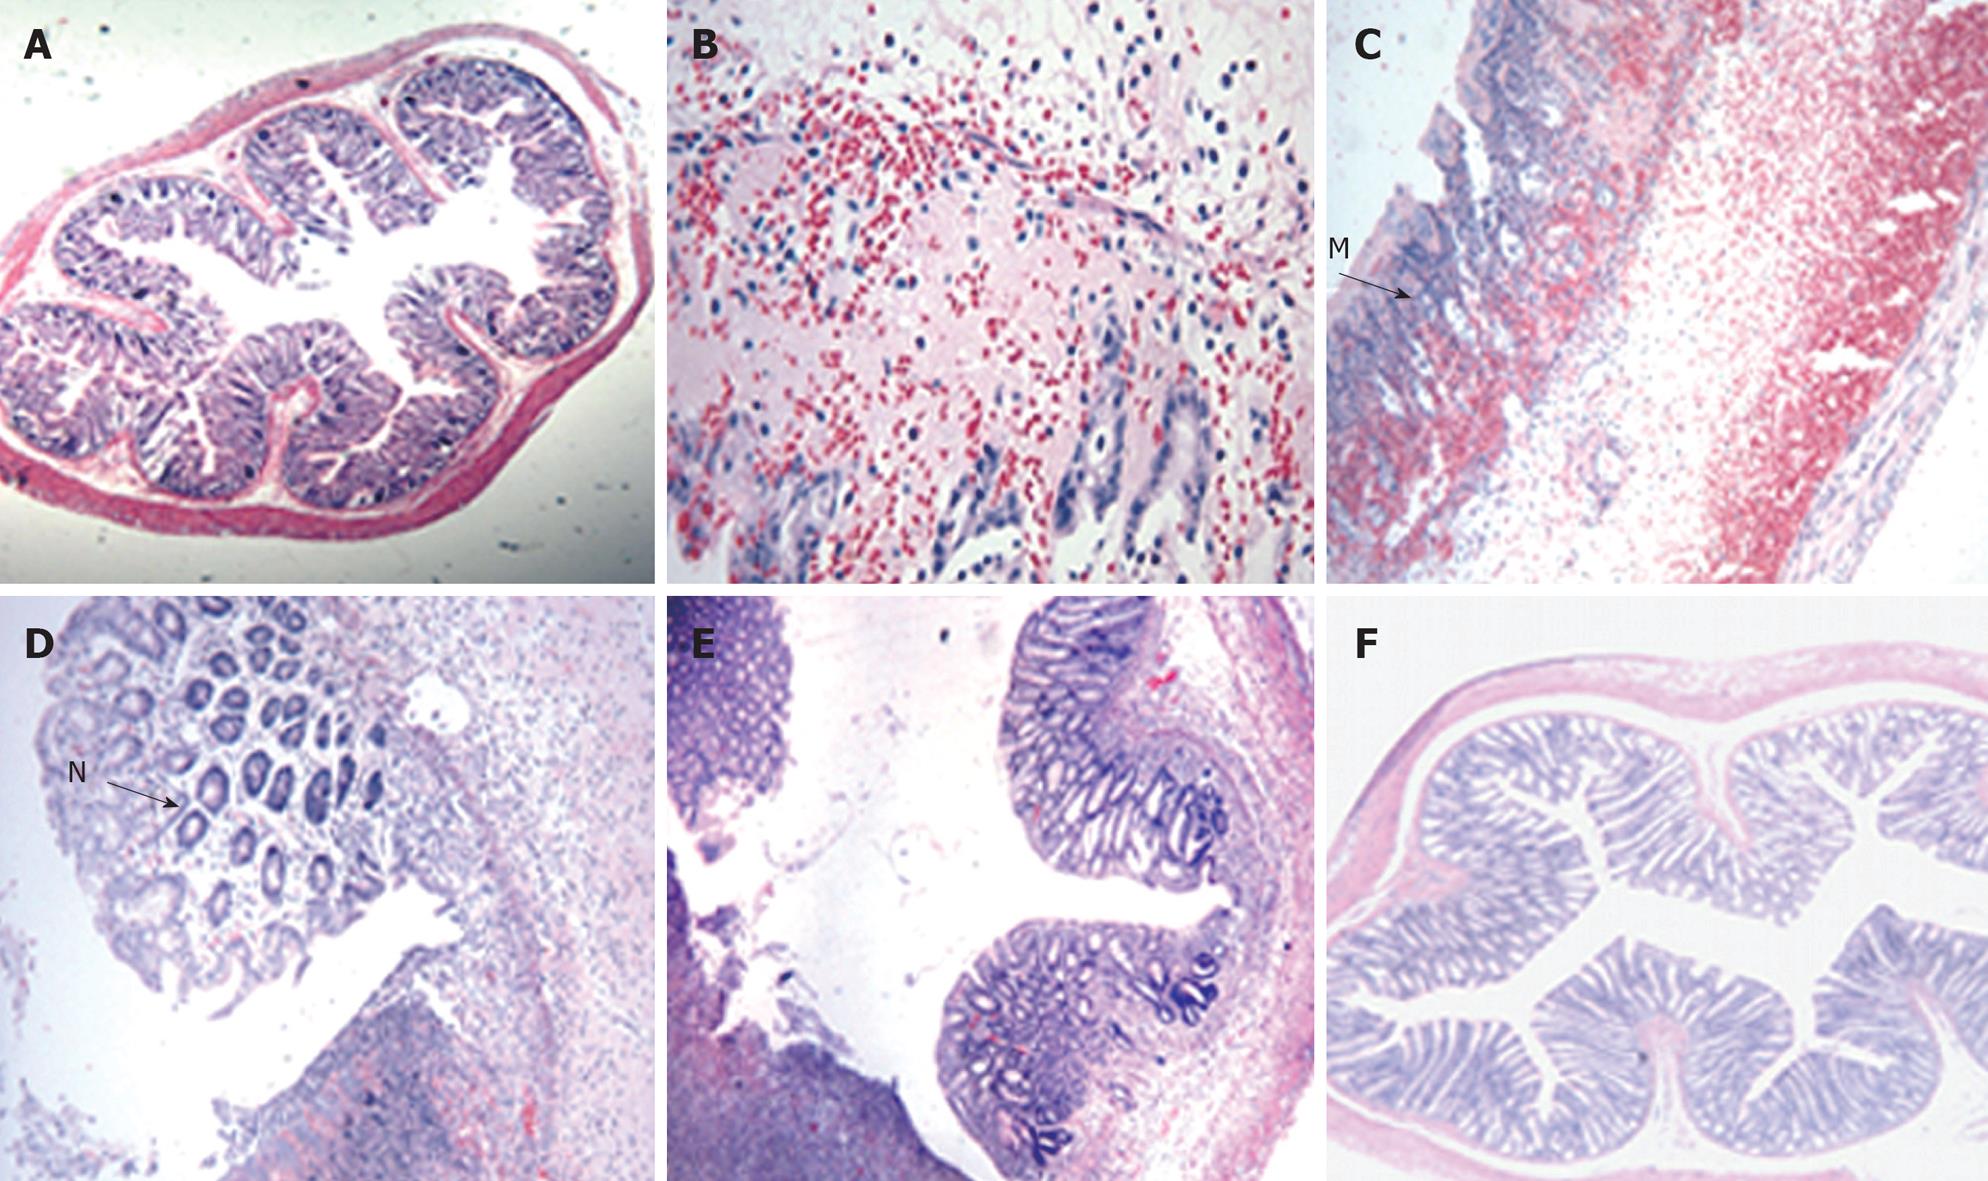
Figure 3 Light photomicrograph of colon tissues from TNBS-induced colitis rats.
In control rats, normal histological colon morphology is evident (A, × 4). At day 3, oedema and haemorrhage at the mucosa with goblet cell depletion were seen (B, × 20). At day 7, severe transmural infiltration of the colon wall developed, with submucosal oedema and haemorrhage, lymphocytic and neutrophilic infiltration (M) and coagulative necrosis (C, × 10). At day 14, goblet cell regeneration (N), oedema and haemorrhage regressed by degrees (D, × 20). At day 21, abundant goblet cells and crypts developed (E, × 10). At day 28, oedema and haemorrhage had almost entirely disappeared, the structure of the muscular layer became compact and the intestinal glands developed highly (F, × 4).
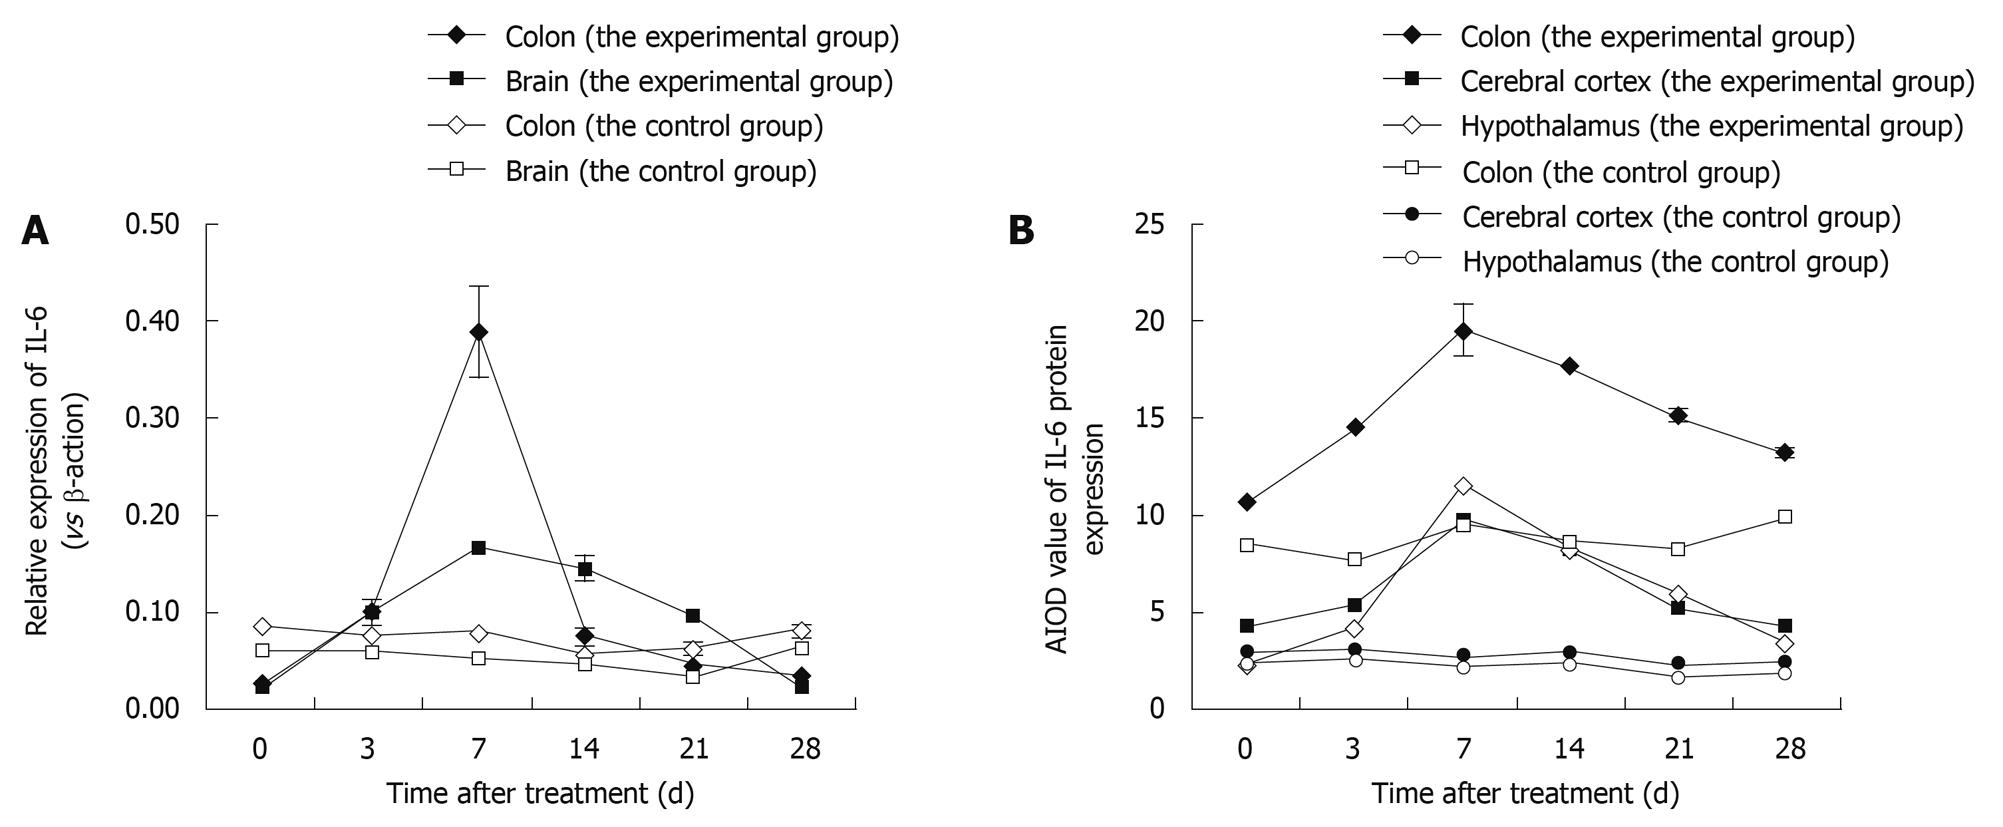
Figure 4 Variation in expression of interleukin-6 (IL-6) in the colon and brain of TNBS-induced colitis rats by time points (at days 3, 7, 14, 21 and 28) vs control rats.
A: The expression of IL-6 mRNA after real-time RT-PCR; Data shown as mean ± SD, n = 4-8; B: The average integrated optical density (AIOD) values for IL-6 protein expression after immunohistochemical staining. The results were determined by ANOVA.
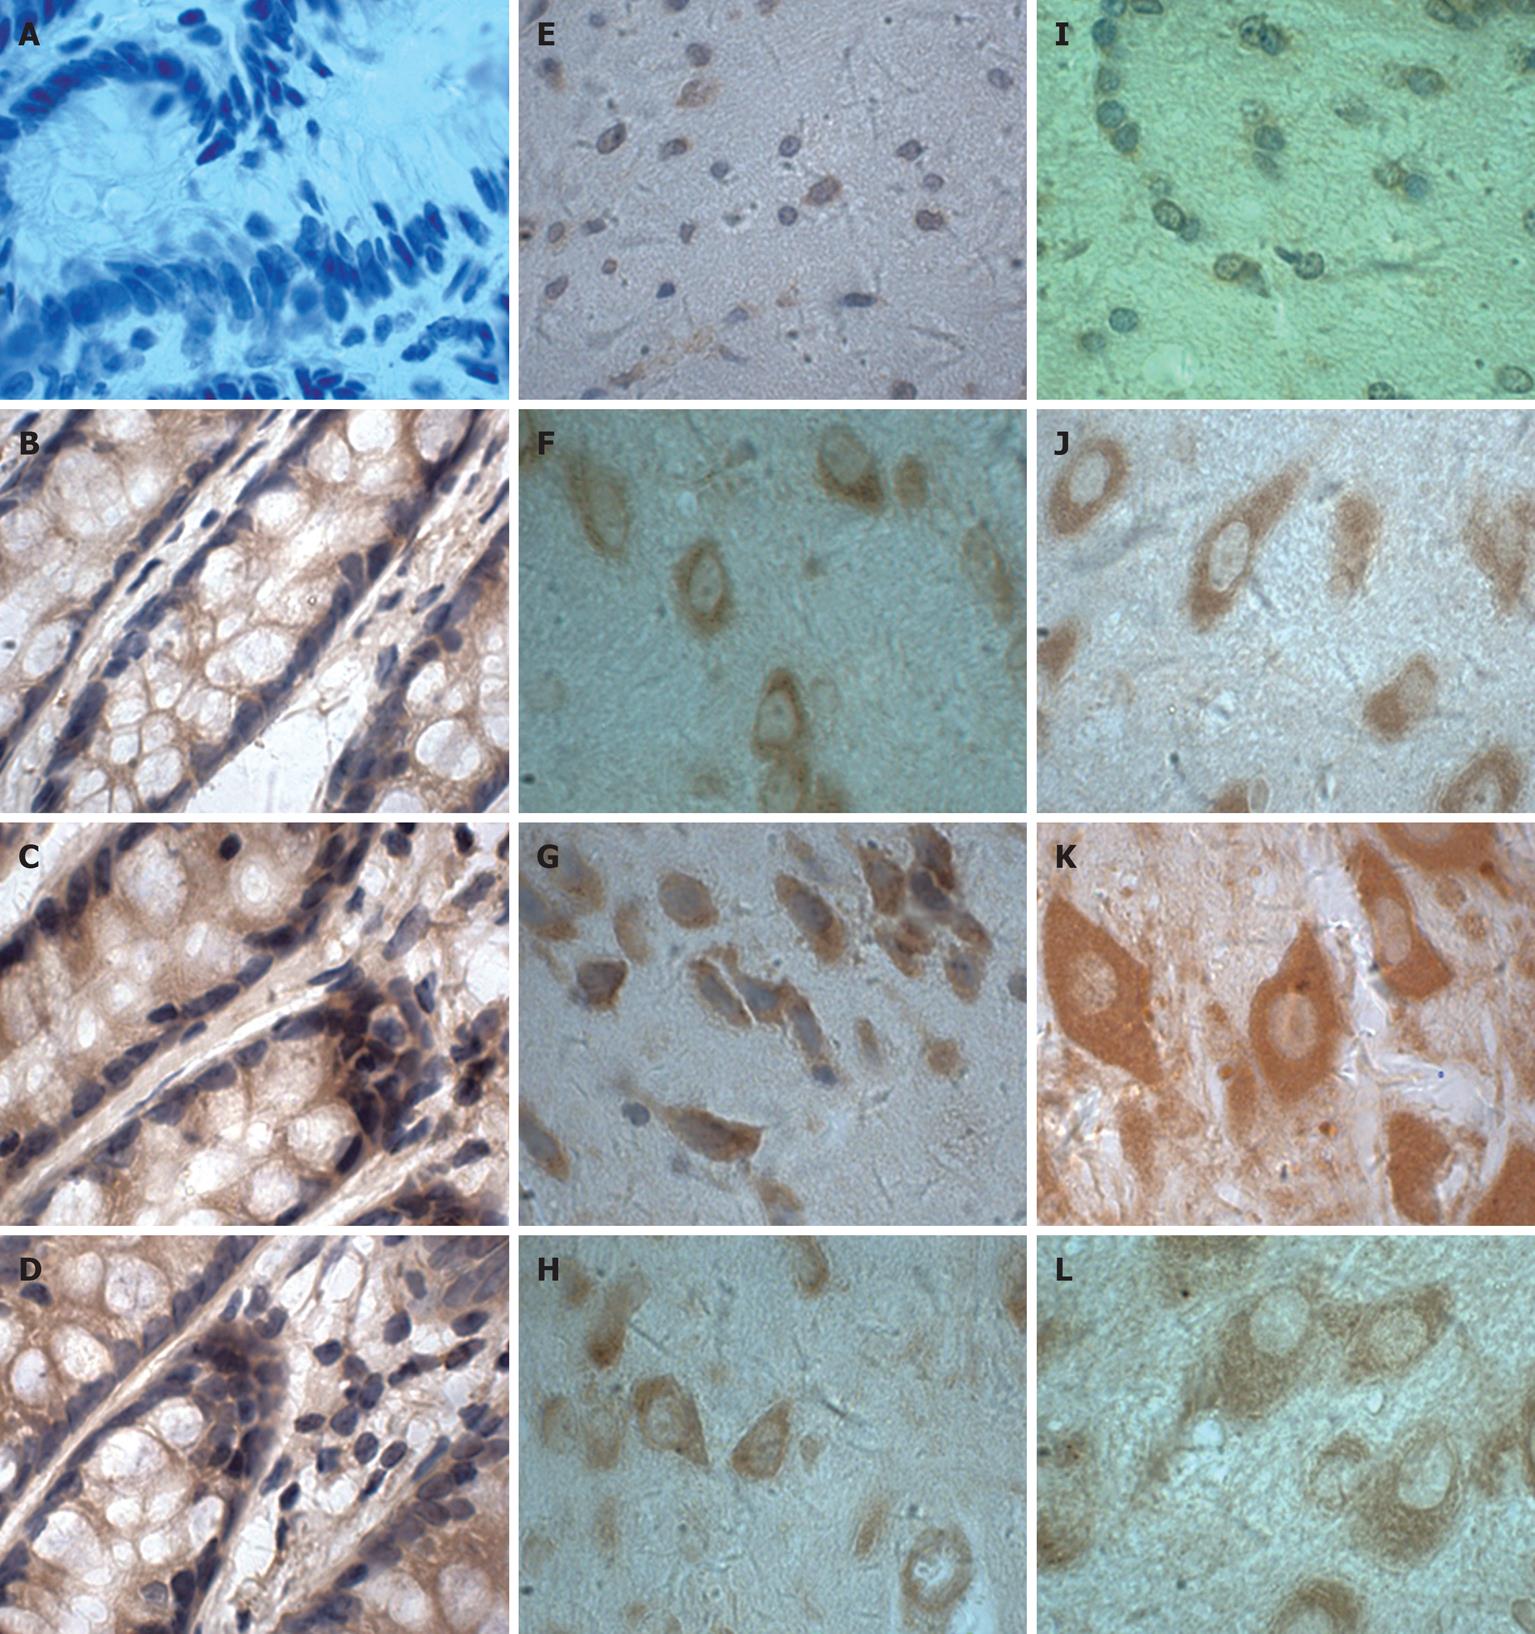
Figure 5 Immunohistochemical localisation of IL-6 proteins in colon (A-D), cerebral cortex (E-H) and hypothalamus (I-L) from TNBS-induced colitis (× 100).
C, G, K: Day 7; D, H, L: Day 28; B, F, J: Day 0; A, E, I: Negative control (the primary antibody was replaced with the corresponding affinity-purified preimmune IgG).
- Citation: Wang K, Yuan CP, Wang W, Yang ZQ, Cui W, Mu LZ, Yue ZP, Yin XL, Hu ZM, Liu JX. Expression of interleukin 6 in brain and colon of rats with TNBS-induced colitis. World J Gastroenterol 2010; 16(18): 2252-2259
- URL: https://www.wjgnet.com/1007-9327/full/v16/i18/2252.htm
- DOI: https://dx.doi.org/10.3748/wjg.v16.i18.2252


