Copyright
©2010 Baishideng.
World J Gastroenterol. May 7, 2010; 16(17): 2109-2119
Published online May 7, 2010. doi: 10.3748/wjg.v16.i17.2109
Published online May 7, 2010. doi: 10.3748/wjg.v16.i17.2109
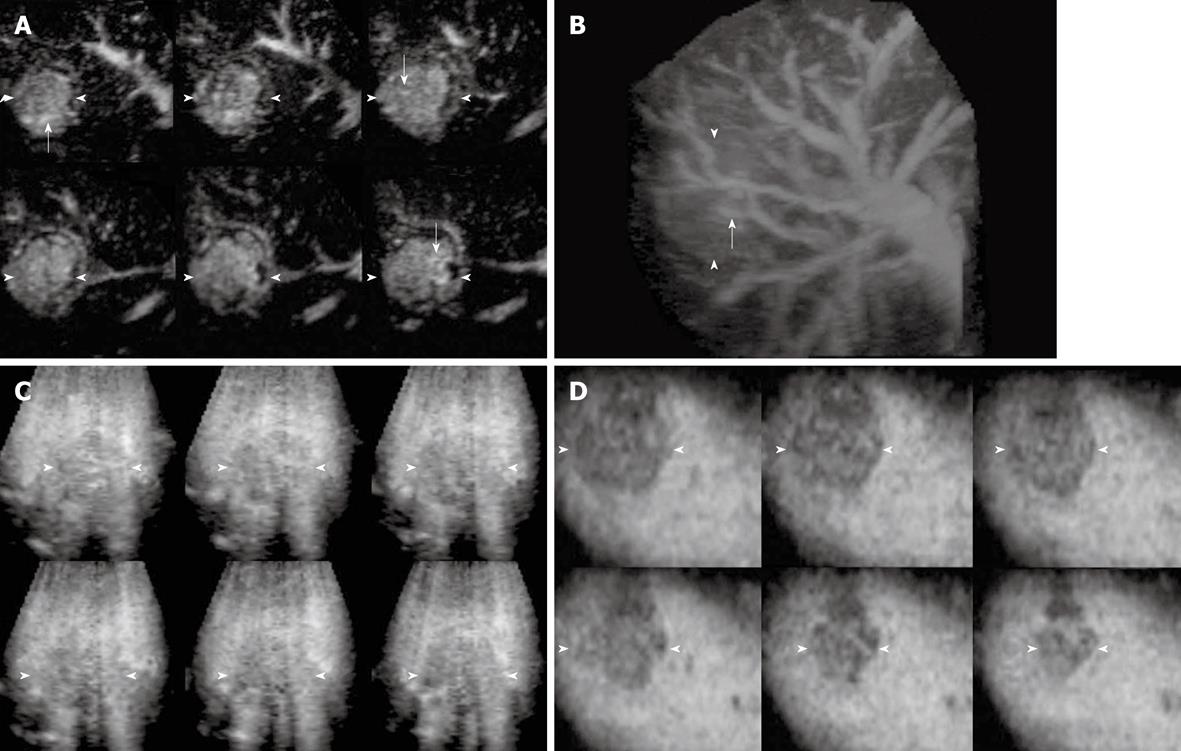
Figure 1 Contrast-enhanced (CE) three-dimensional ultrasonography (3D US) images of the liver in a 57-year-old man with hepatocellular carcinoma (HCC) in the anterior superior segment of the right lobe.
A, B: Tomographic ultrasound image with slice distance 1.5 mm in plane A (A) and the sonographic angiogram rendered by maximum intensity with surface mode (B) show diffuse enhancement with intratumoral vessels (arrows) in the early phase; C: Tomographic ultrasound image with slice distance 2.0 mm in plane B shows diffuse enhancement in the middle phase; D: Tomographic ultrasound image with slice distance 2.0 mm in plane C shows hypoechoic pattern in the late phase. Enhancement change of washout was detected in this lesion. Arrowheads indicate the tumor margin.
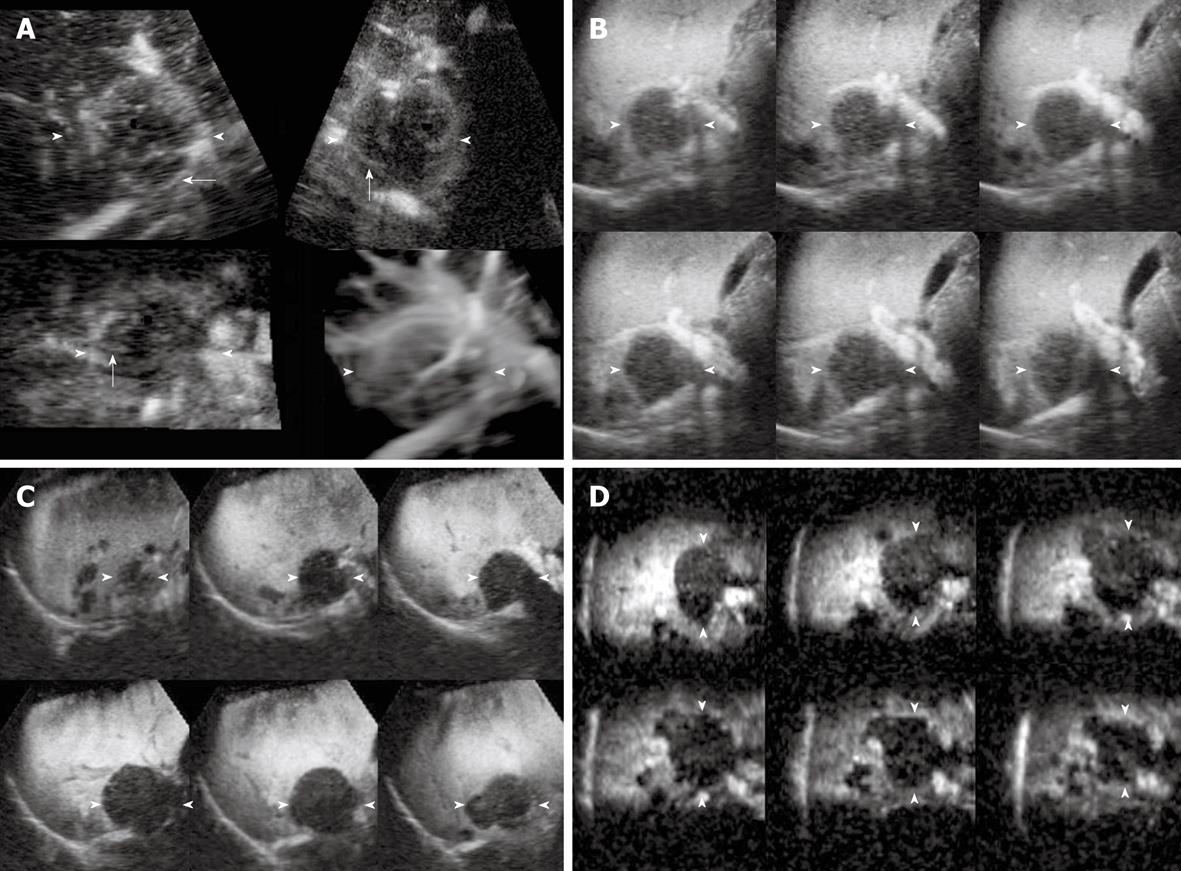
Figure 2 CE 3D US images of the liver in a 64-year-old woman with metastases from pancreatic carcinoma in the anterior superior segment of the right lobe.
A: Images in the early phase show peripheral ring-like enhancement with peritumoral vessels (arrows) in plane A (upper left), plane B (upper right), plane C (lower left) and the sonographic angiogram rendered by average intensity with surface mode (lower right); B: Tomographic ultrasound image with slice distance 2.0 mm in plane A shows peripheral ring-like enhancement in the middle phase; C, D: Tomographic ultrasound images (TUI) in plane A with slice distance 2.5 mm (C) and that in plane C with slice distance 2.0 mm (D) show hypoechoic pattern in the late phase. Enhancement change of washout was detected in this lesion. Arrowheads indicate the tumor margin.
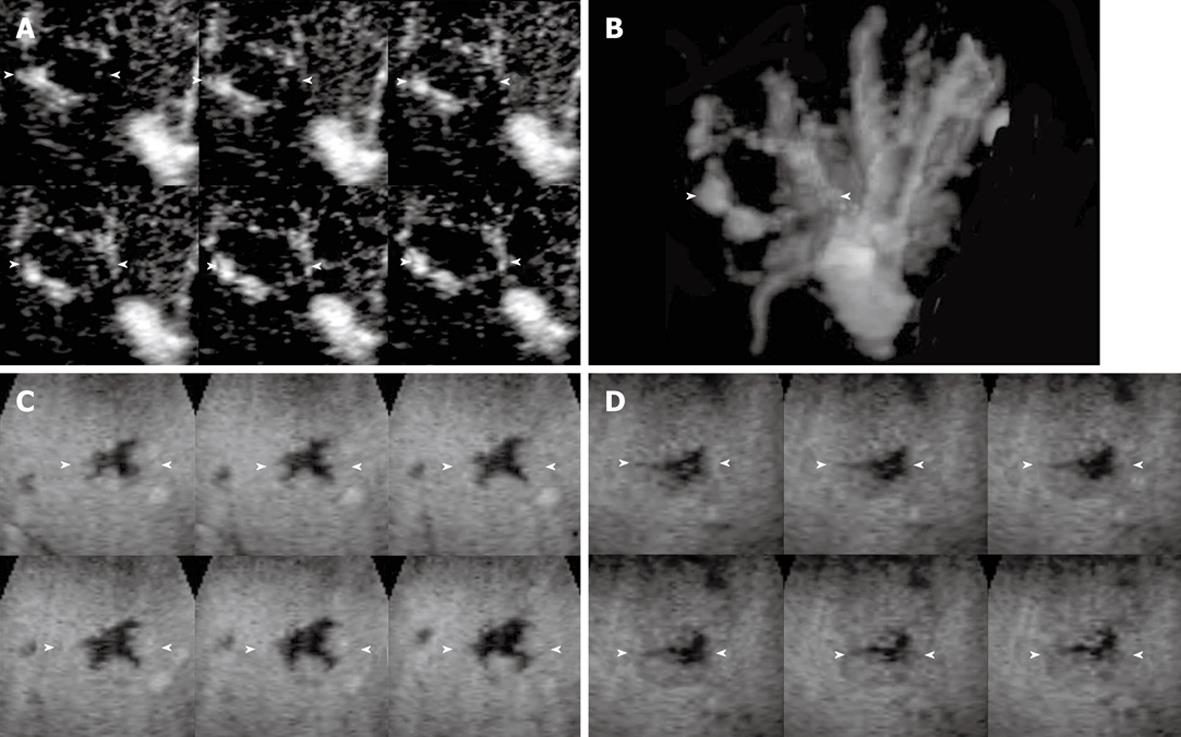
Figure 3 CE 3D US images of the liver in a 59-year-old woman with a hemangioma in the anterior inferior segment of the right lobe.
A, B: Tomographic ultrasound image in plane A with slice distance 1.0 mm (A) and sonographic angiogram rendered by average intensity with surface mode (B) show peripheral nodular enhancement without distinct tumor vessels in the early phase; C: Tomographic ultrasound image in plane B with slice distance 1.0 mm shows peripheral nodular enhancement in the middle phase; D: Tomographic ultrasound image with slice distance 1.0 mm in plane B with slice distance 1.0 mm shows hypoechoic pattern in the late phase. Persistent enhancement over time was detected in this lesion. Arrowheads indicate the tumor margin.
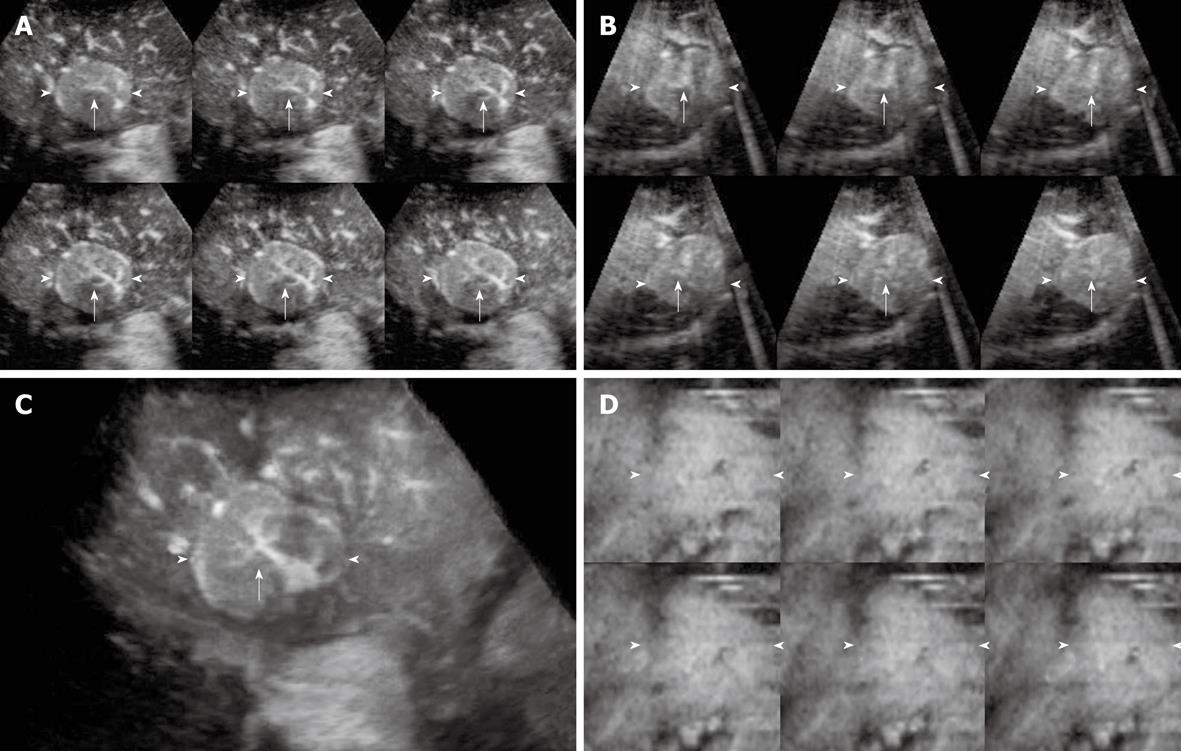
Figure 4 CE 3D US images of the liver in a 77-year-old man with FNH in the medial segment of the left lobe.
A-C: TUI in plane A with slice distance 1.5 mm (A) and plane B with slice distance 1.5 mm (B), and the sonographic angiogram rendered by maximum intensity with surface mode (C) show diffuse enhancement with spoke-wheel arteries (arrows) in the early phase; D: TUI in plane C with slice distance 2.5 mm show isoechoic pattern in the late phase and hypoechoic regions within the tumor indicate central scars. Persistent enhancement over time was detected in this lesion. Arrowheads indicate the tumor margin.
- Citation: Luo W, Numata K, Morimoto M, Nozaki A, Ueda M, Kondo M, Morita S, Tanaka K. Differentiation of focal liver lesions using three-dimensional ultrasonography: Retrospective and prospective studies. World J Gastroenterol 2010; 16(17): 2109-2119
- URL: https://www.wjgnet.com/1007-9327/full/v16/i17/2109.htm
- DOI: https://dx.doi.org/10.3748/wjg.v16.i17.2109


