Copyright
©2010 Baishideng.
World J Gastroenterol. Apr 21, 2010; 16(15): 1837-1844
Published online Apr 21, 2010. doi: 10.3748/wjg.v16.i15.1837
Published online Apr 21, 2010. doi: 10.3748/wjg.v16.i15.1837
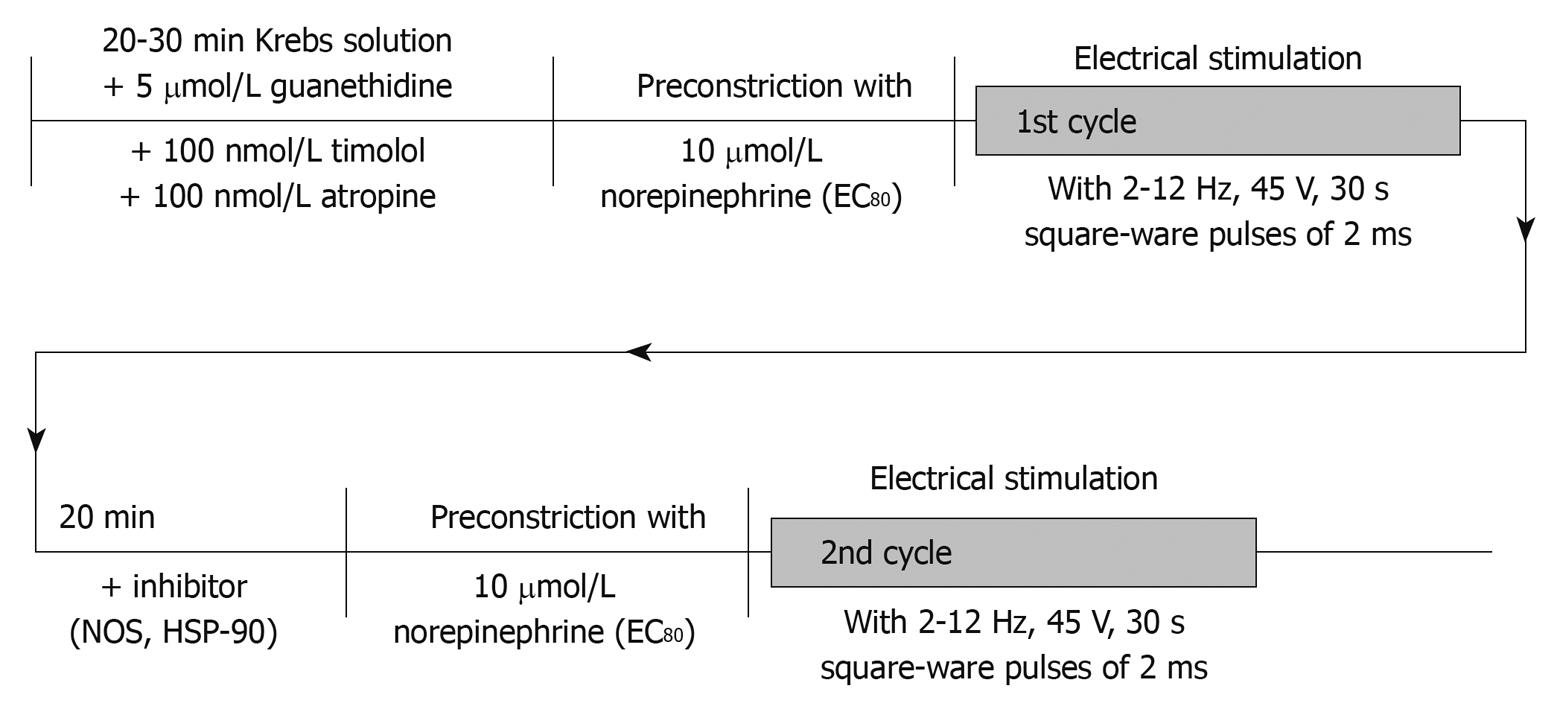
Figure 1 Experimental study protocol.
In this illustration, the chronological order of applications of drugs and performance of peri-arterial nerve stimulation (PNS) is shown. EC80: Concentration achieving 80% maximal vasoconstriction; NOS: Nitric oxide synthase; HSP-90: Heat shock protein-90.
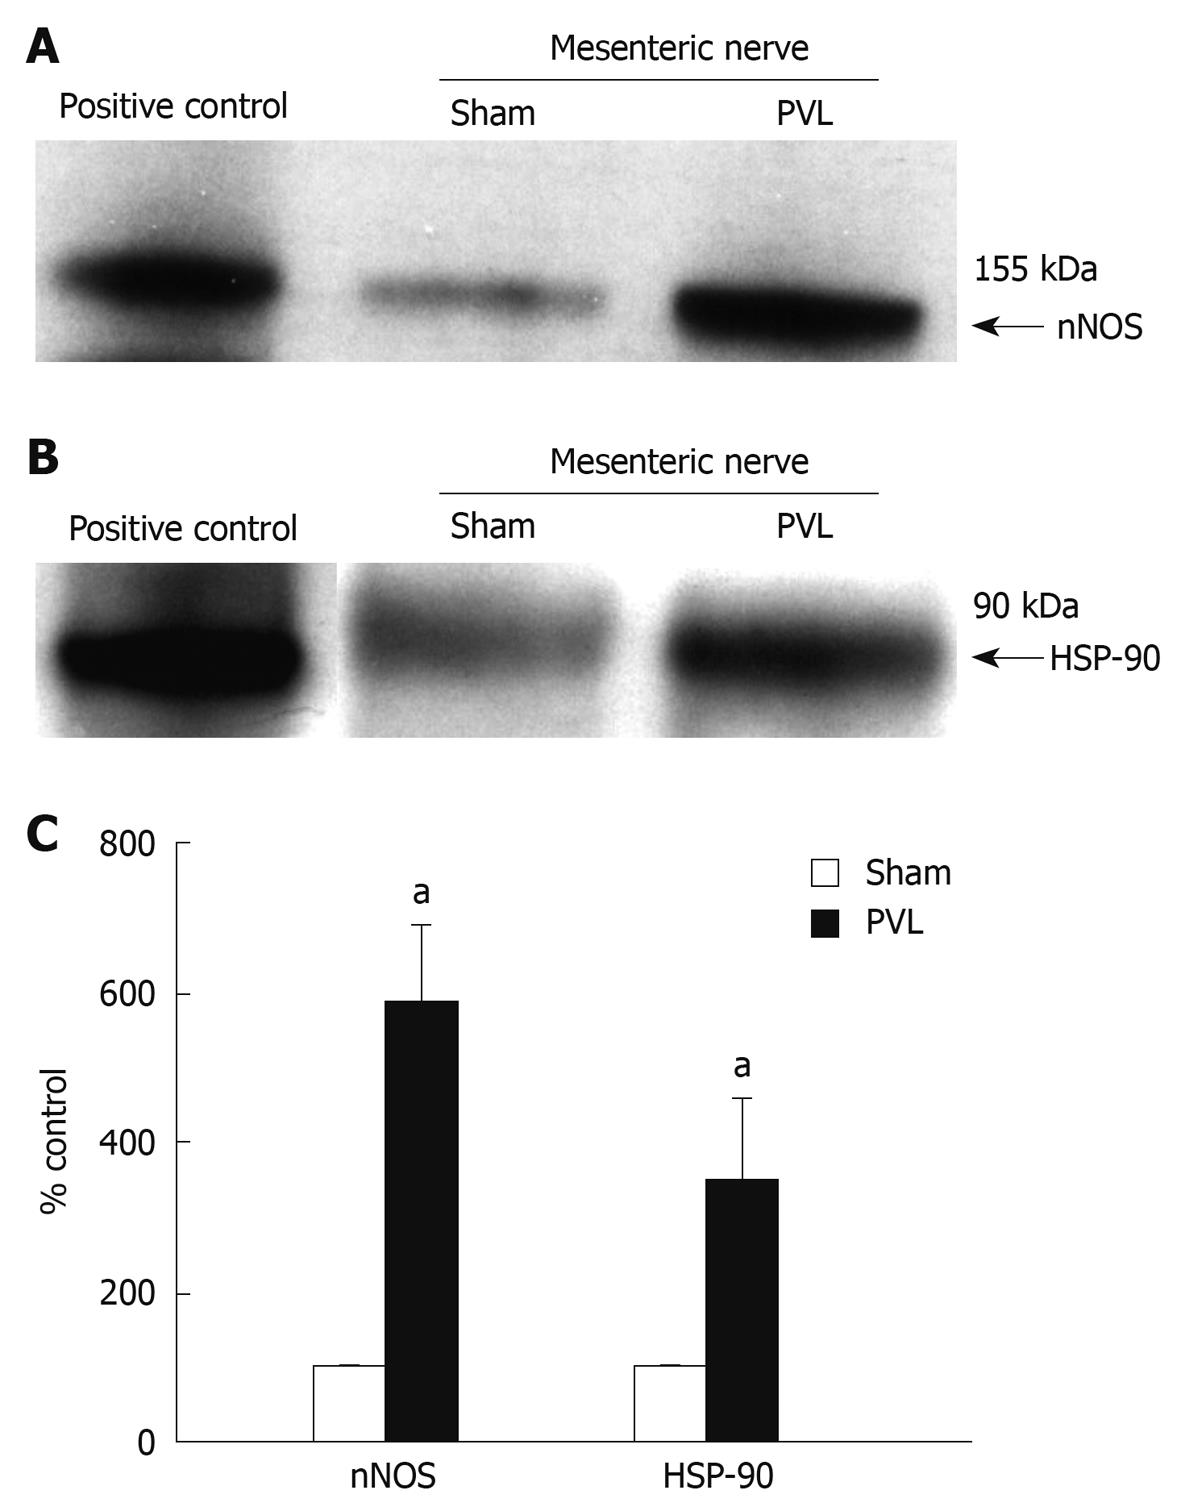
Figure 2 n-nitric oxide synthase (nNOS) and HSP-90 expression in mesenteric nerves.
nNOS (A) and HSP-90 (B) in mesenteric nerves of portal-vein-ligated rats (PVL) and sham rats by Western blotting analysis. Protein lysate from rat brain tissue was used as positive control; C: Densitometric analysis of Western blottings revealed a more than 5-fold increase of nNOS and approximately 3-fold increase of HSP-90 protein expression in mesenteric nerves of PVL rats as compared to sham rats. aP < 0.05, n = 3 per group.
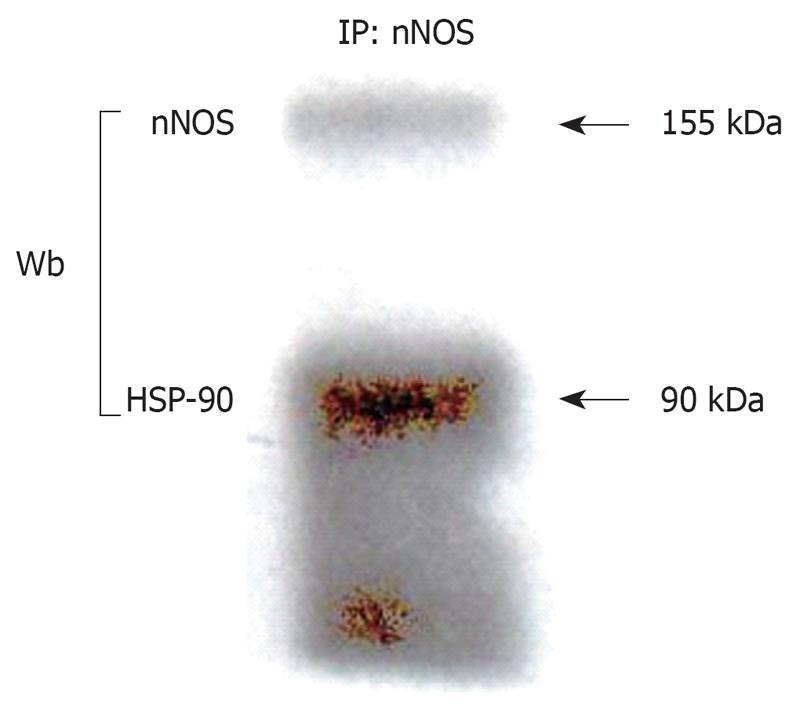
Figure 3 Co-immunoprecipitation.
nNOS was immunoprecipitated from detergent-soluble protein lysates prepared from de-endothelialized mesenteric tissue harvested as described in materials and methods and prepared for gel electrophoresis or, alternatively, protein samples were directly prepared for gel electrophoresis. nNOS and HSP-90 are both abundantly expressed in mesenteric tissue and immunoprecipitation (IP) of nNOS coprecipitates HSP-90 under basal conditions. Wb: Western blotting.
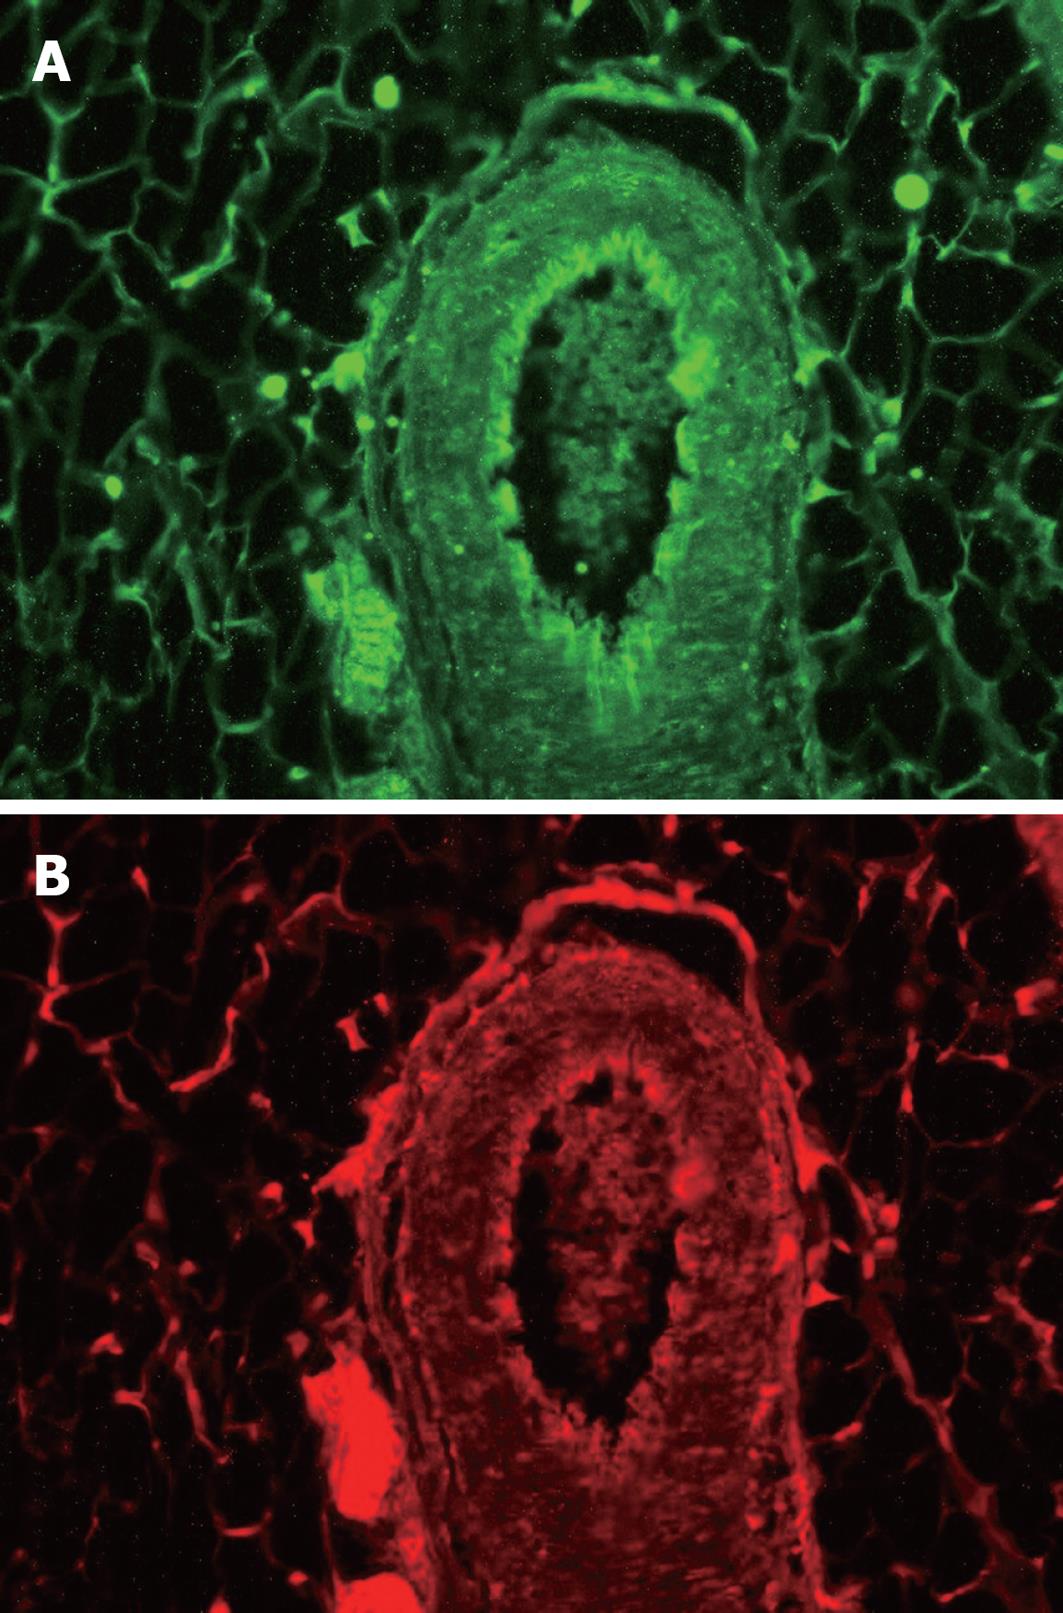
Figure 4 Immunofluoresence analysis of nNOS and HSP-90.
As can be seen immunofluorescence shows strong signals for nNOS (A) and HSP-90 (B) mainly at the entry of the nerve bundle along the adventitia revealing identical localization of nNOS and HSP-90 protein in mesenteric nervous tissue.
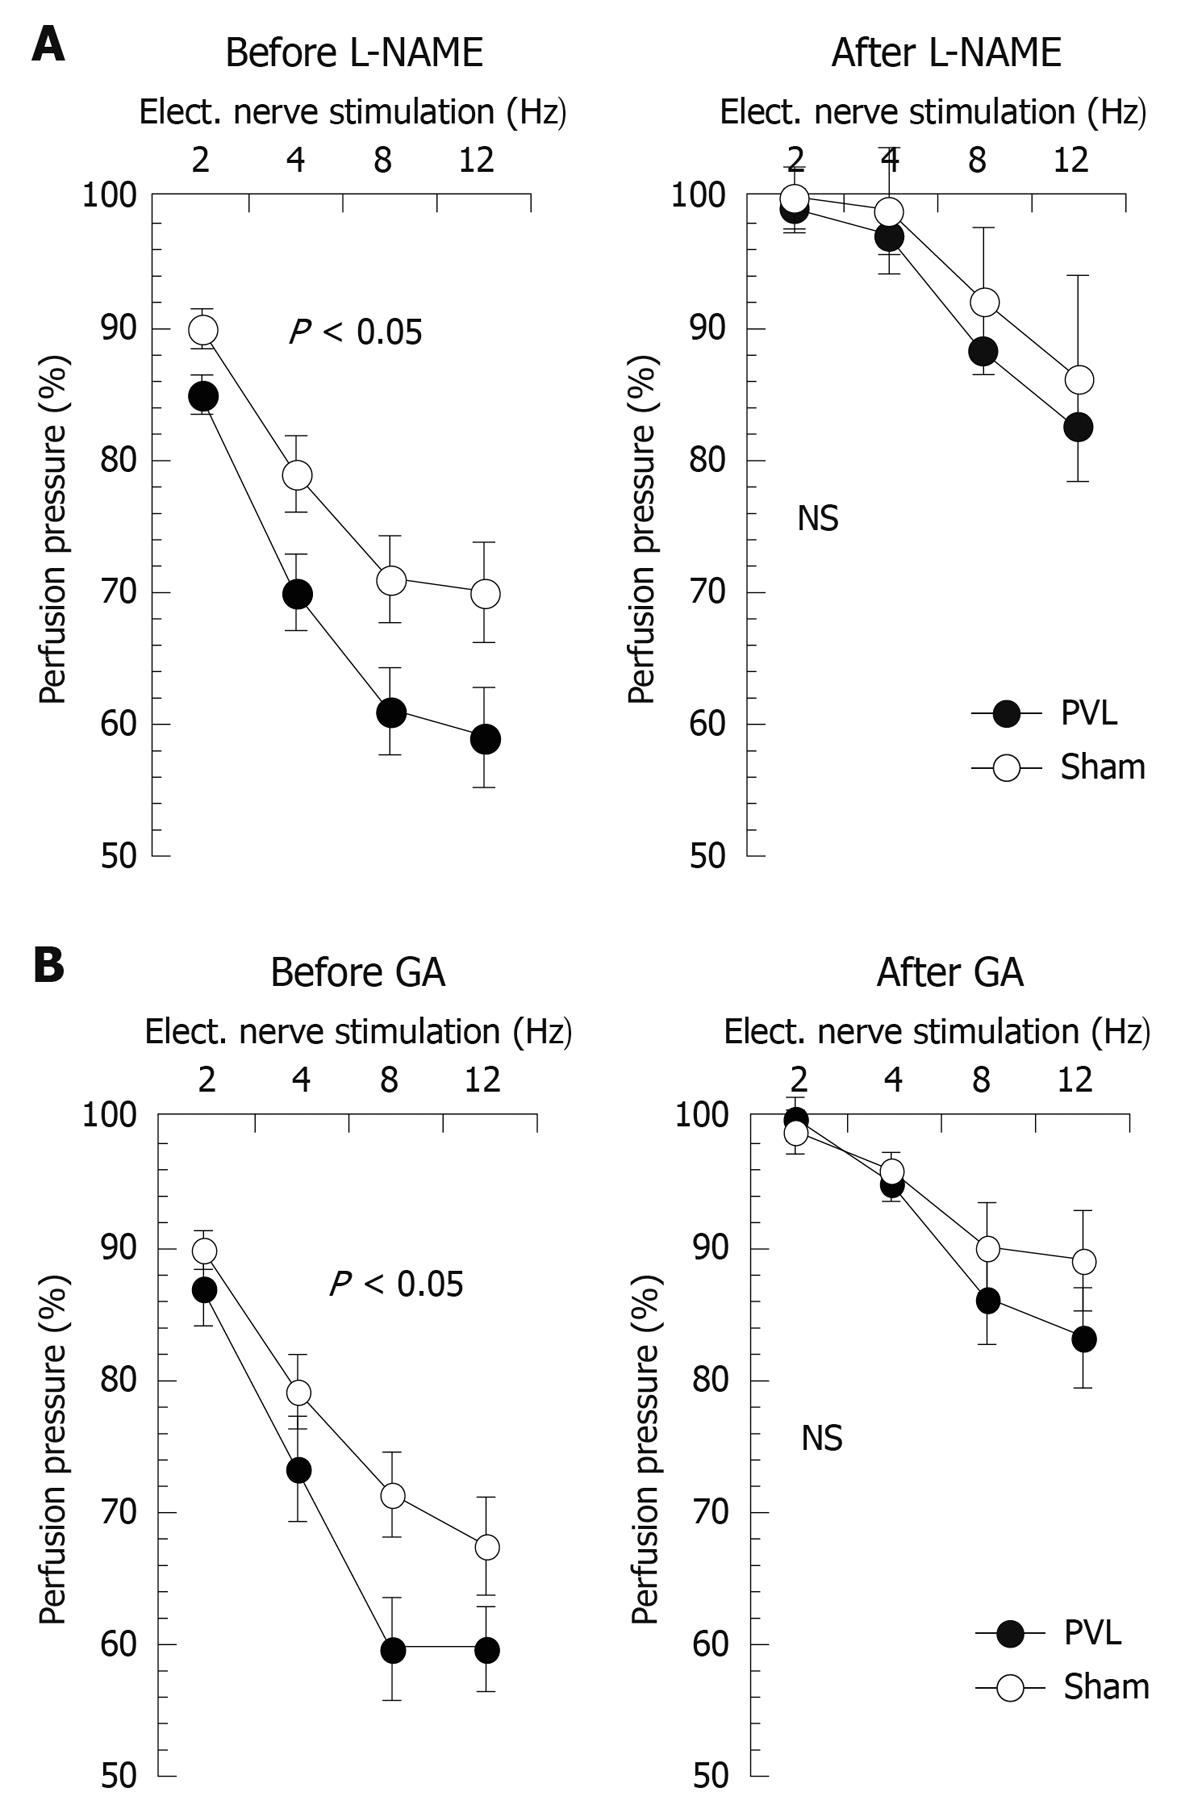
Figure 5 nNOS- and HSP-90-mediated neuronal vasorelaxation in PVL and sham rats.
PNS-induced nitrergic vasorelaxation in de-endothelialized mesenteric vasculature is depicted before and after L-NAME (A) as well as before and after HSP-90-inhibition with geldanamycin (B). It can be appreciated that no more significant differences in frequency-dependent neuronal vasorelaxation were observed between the study groups after L-NAME as well as after geldanamycin. Values given as mean ± SE. PVL-group: n = 6; Sham group: n = 6. P < 0.05 for ANOVA comparing study groups. Elect. nerve stimulation: Electric nerve stimulation; NS: Not significant.
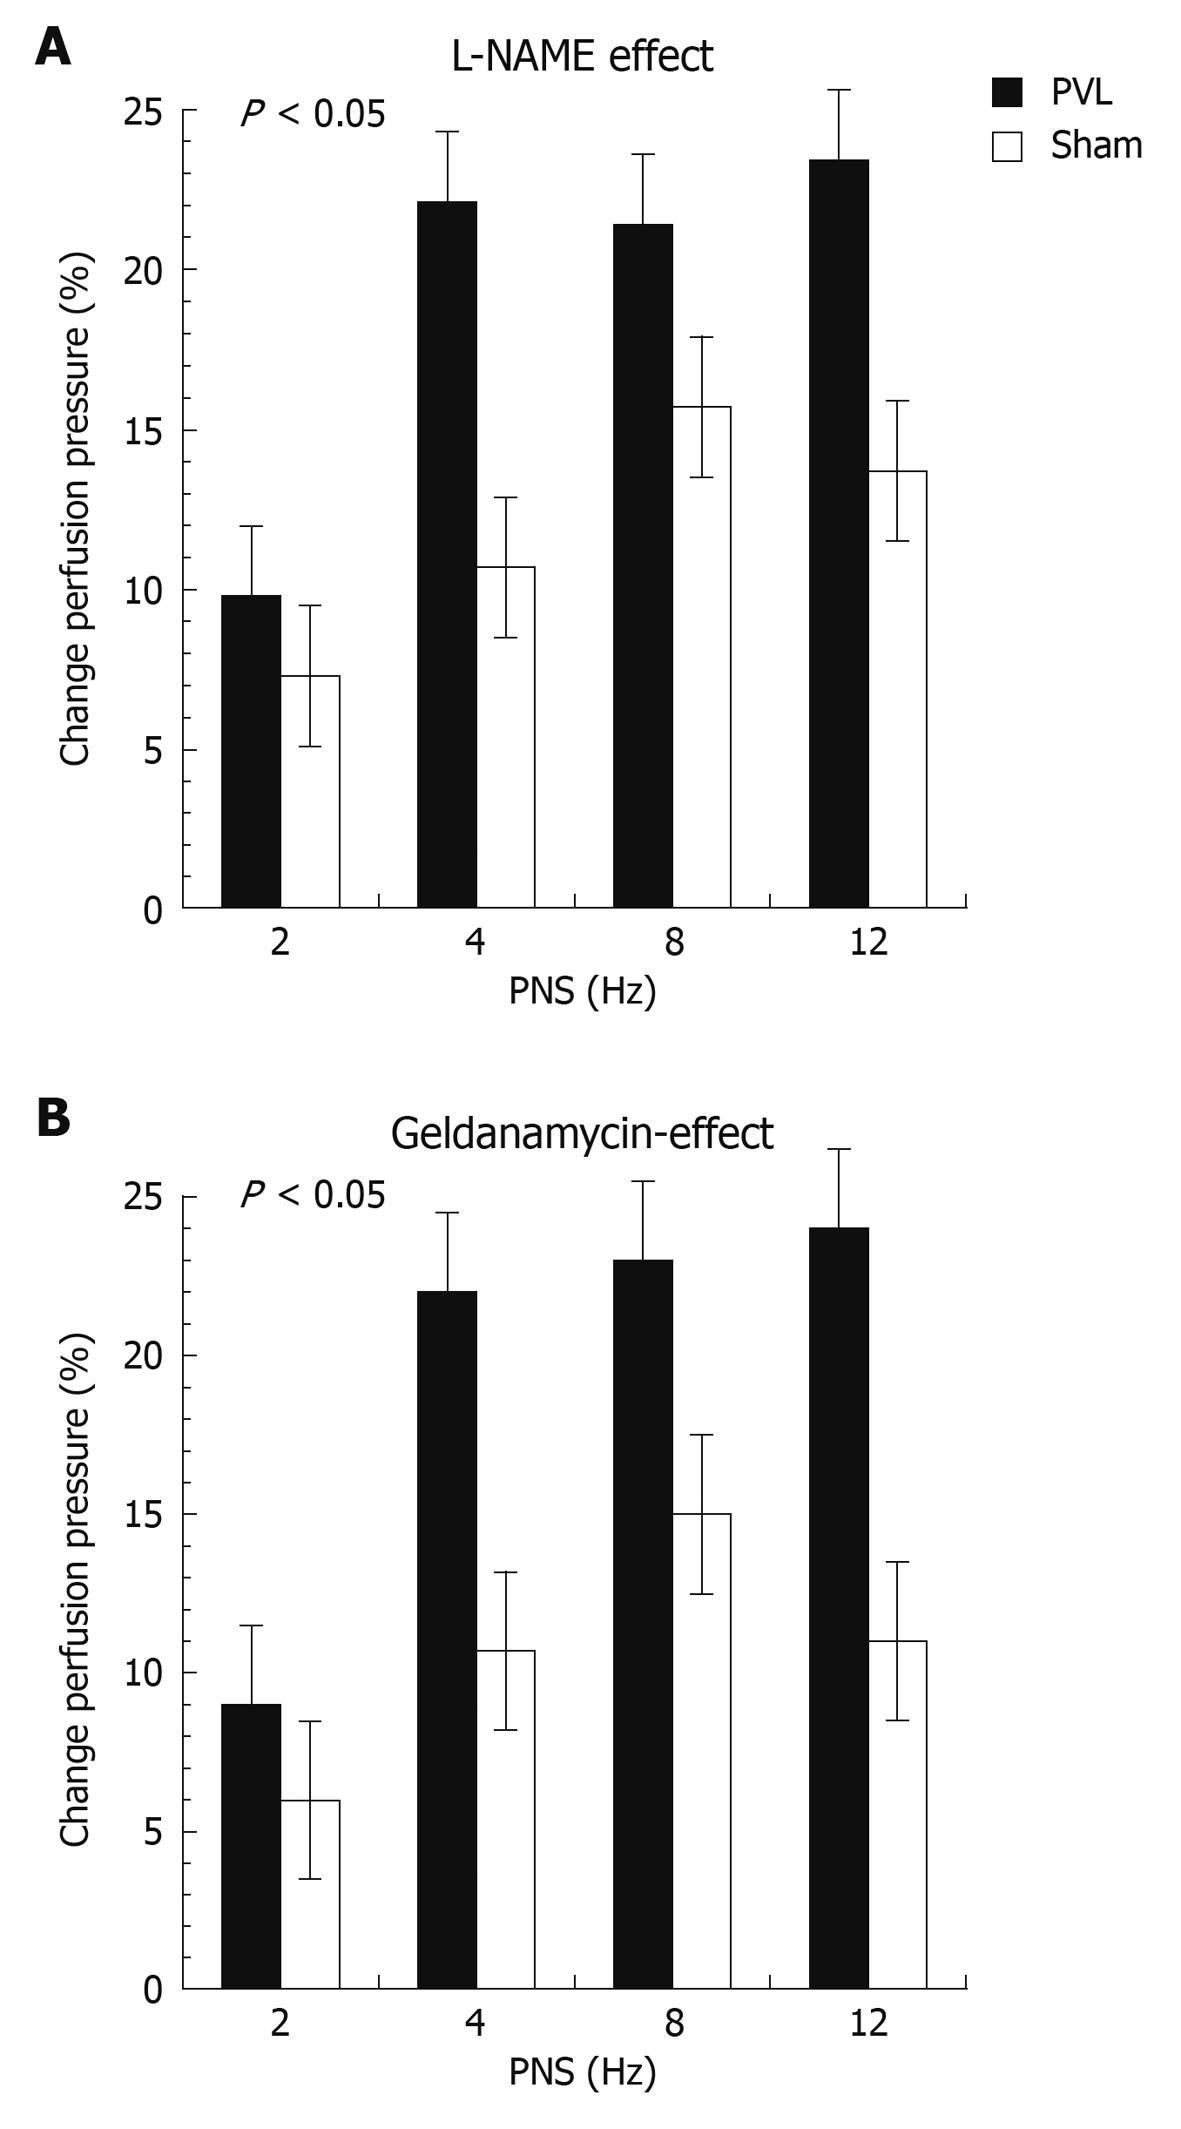
Figure 6 Changes in PNS-induced vasorelaxation induced by inhibition of NOS or HSP-90.
Changes in pressure response to PNS induced by L-NAME (A) and geldanamycin (B) presented as percent change in perfusion pressure as compared to values obtained during the first perfusion cycle. P < 0.05 (ANOVA comparing all conditions between study groups) vs sham, respectively.
- Citation: Moleda L, Jurzik L, Froh M, Gäbele E, Hellerbrand C, Straub RH, Schölmerich J, Wiest R. Role of HSP-90 for increased nNOS-mediated vasodilation in mesenteric arteries in portal hypertension. World J Gastroenterol 2010; 16(15): 1837-1844
- URL: https://www.wjgnet.com/1007-9327/full/v16/i15/1837.htm
- DOI: https://dx.doi.org/10.3748/wjg.v16.i15.1837


