Copyright
©2010 Baishideng.
World J Gastroenterol. Mar 28, 2010; 16(12): 1465-1472
Published online Mar 28, 2010. doi: 10.3748/wjg.v16.i12.1465
Published online Mar 28, 2010. doi: 10.3748/wjg.v16.i12.1465
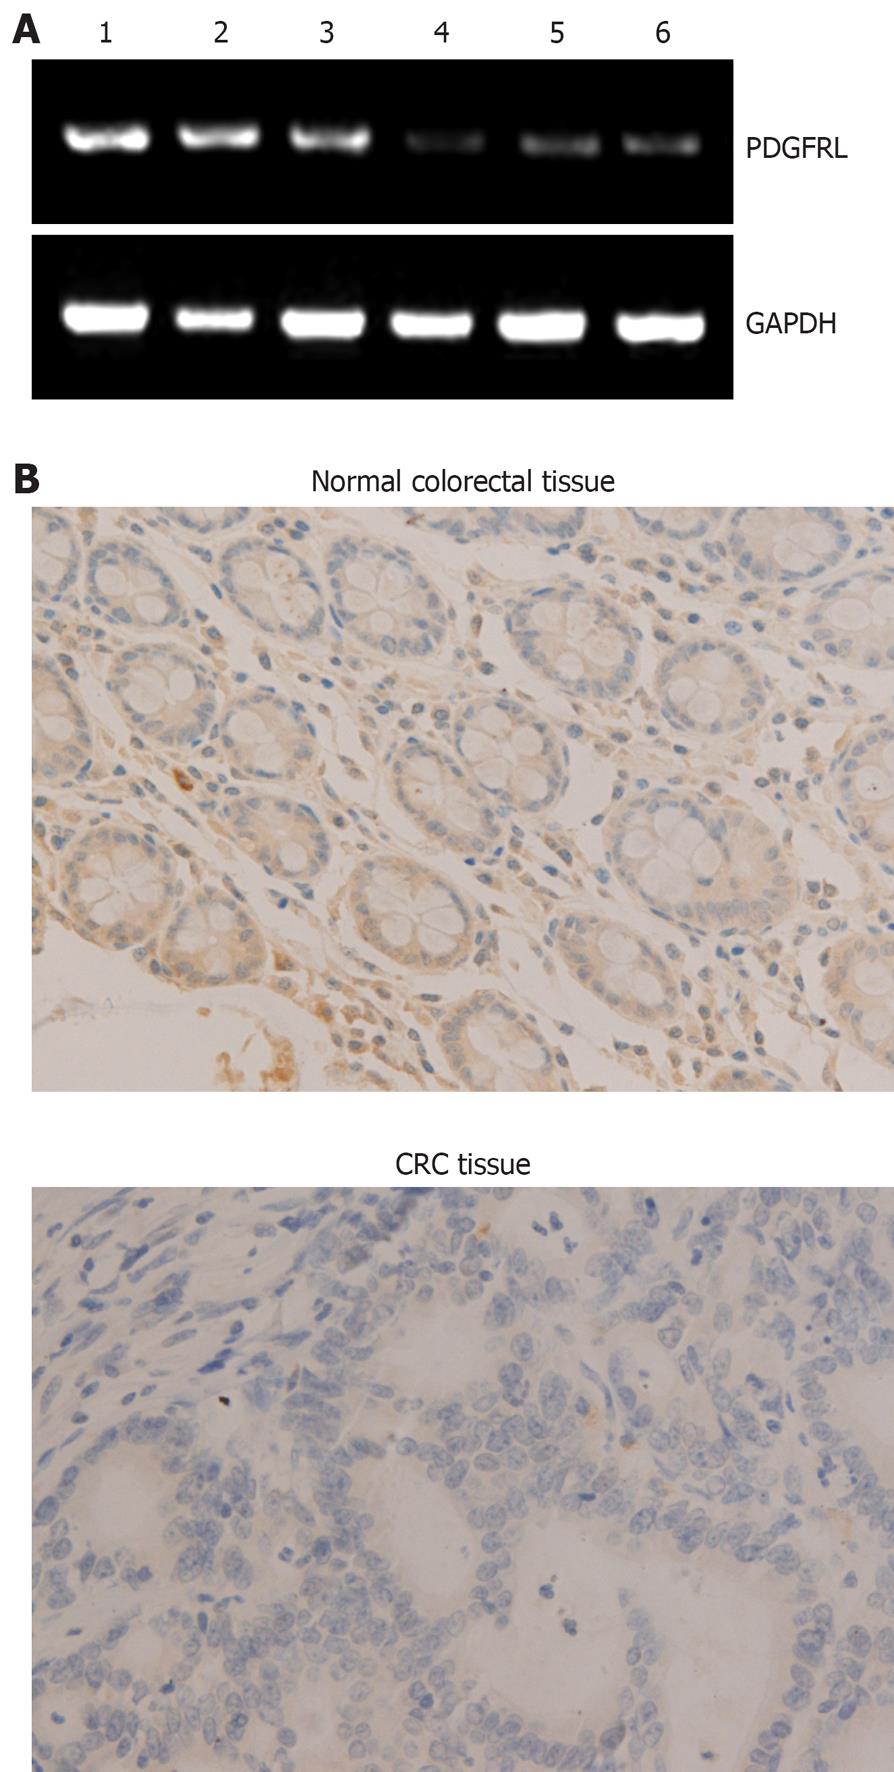
Figure 1 Expression of platelet-derived growth factor receptor-like gene (PDGFRL) in colorectal cancer and normal tissues.
A: Reverse transcription-polymerase chain reaction (RT-PCR) analysis shows that mRNA levels in colorectal cancer tissues were lower than in normal tissues. 1-3: Normal colorectal tissues; 4-6: Colorectal cancer tissues; B: Immunohistochemical analysis illustrates that immunoreaction signal of PDGFRL in cancer tissues was weak compared with normal tissues. (Magnification, × 100). GAPDH: Glyceraldehyde-3-phosphate dehydrogenase; CRC: Colorectal cancers.
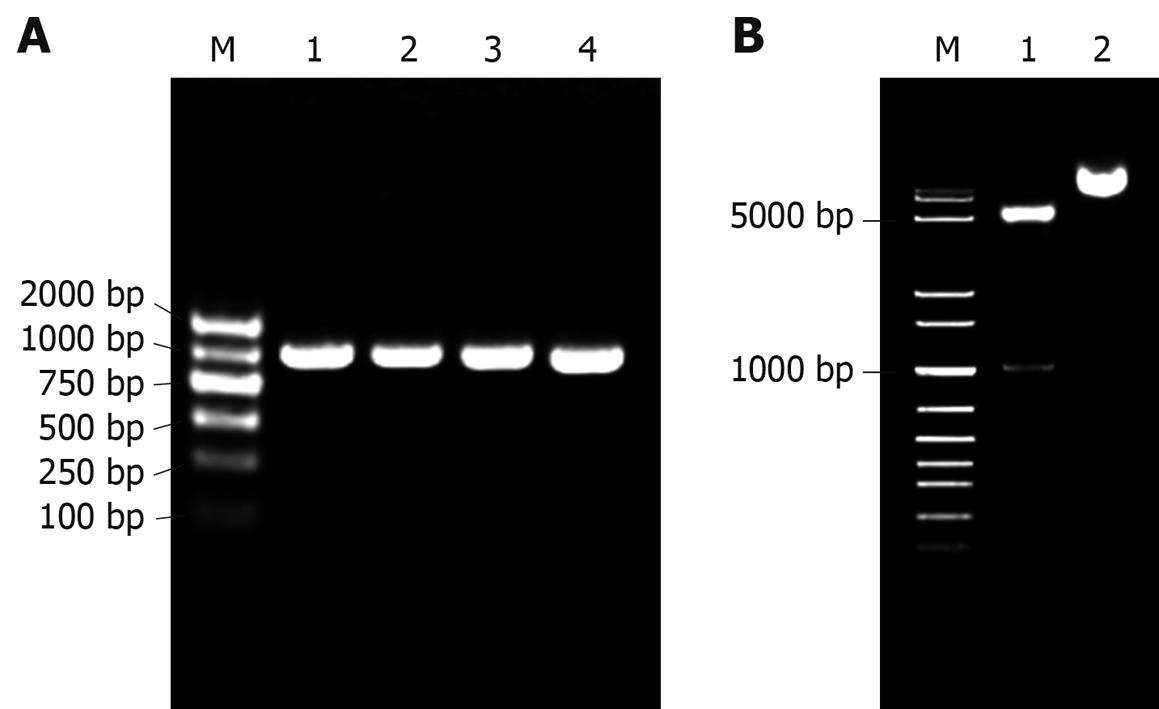
Figure 2 Construction of pET22b-PDGFRL.
A: Bacterial colony PCR for detection of DH5a clones with prokaryotic recombinant expression vector pET22b-PDGFRL. M: DNA ladder; 1-4: Positive bacterial colonies; B: Double endonuclease digestion of the recombinant vector pET22b-PDGFRL. M: DNA ladder; 1: Double digestion with NcoI/XhoI; 2: pET22b-PDGFRL without digestion.
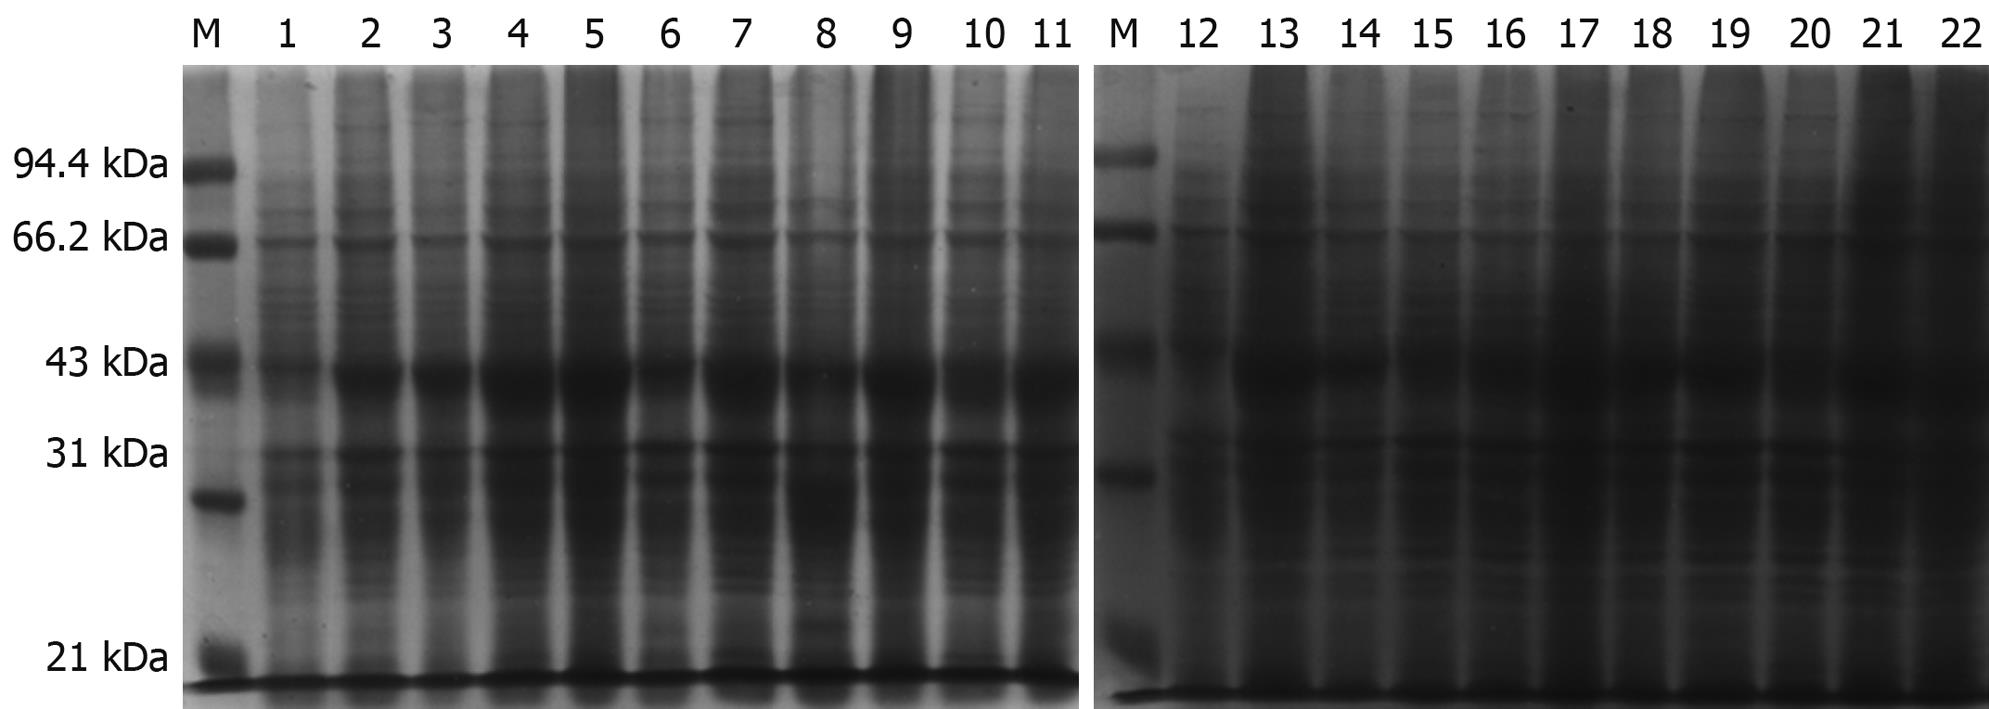
Figure 3 Protein expression in Escherichia coli containing pET22b-PDGFRL.
Time course and different concentrations of isopropyl-b-D-thiogalactopyranoside (IPTG) analysis of pET22b-PDGFRL protein expression by sodium dodecyl sulfate-polyacrylamide gel electrophoresis (SDS-PAGE). M: Molecular weight standards; 1, 12: Uninduced bacterial lysate; 1-h (2-6), 2-h (7-11), 3-h (13-17), 4-h (18-22) induced samples at different concentrations of IPTG culture (0.1, 0.5, 1.0, 1.5, 2.0 μg/mL).
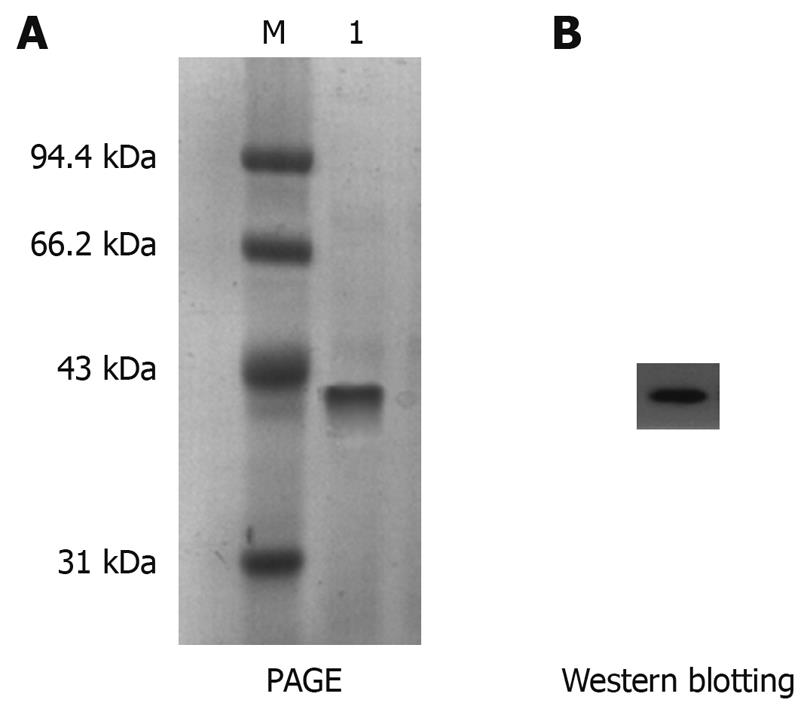
Figure 4 Purification of His-PDGFRL recombinant protein.
A: Purification of His-tagged His-PDGFRL recombinant protein by immobilized metal affinity chromatography. M: Molecular weight standards; 1: The purified protein; B: Purification of recombinant protein confirmed by immunoblotting using anti-His-Tag antibody.
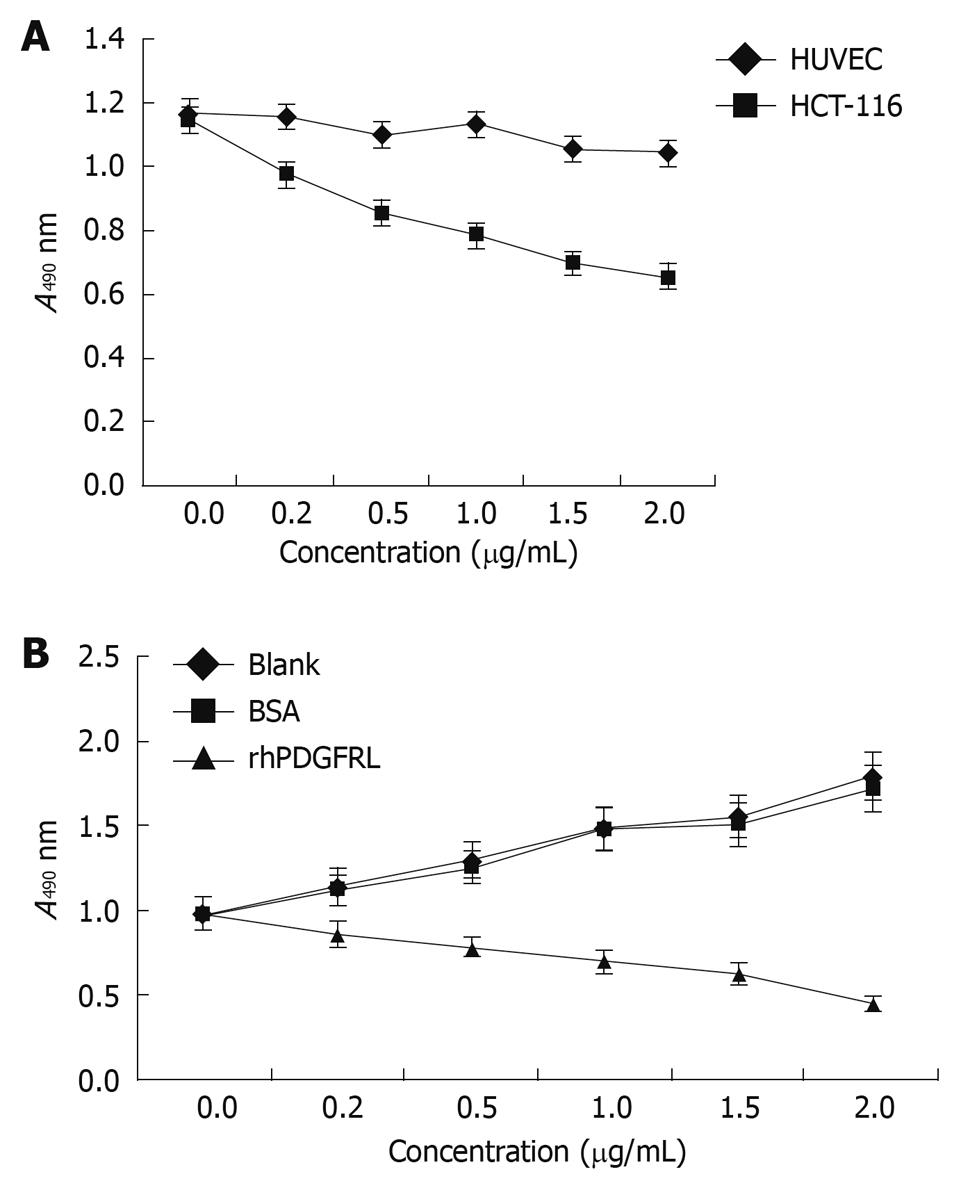
Figure 5 PDGFRL inhibits HCT-116 cell proliferation.
A: MTT assay shows that HCT-116 cells grew slowly compared with human umbilical vein endothelial cells (HUVEC) cells after PDGFRL protein treatment, P < 0.05, HCT116 vs HUVEC; B: HCT-116 cells were treated with rhPDGFRL (HCT-116/rhPDGFRL) or bovine serum albumin (BSA) (HCT-116/BSA), P < 0.05, rhPDGFRL vs BSA. Data are expressed as mean ± SD of three independent experiments.
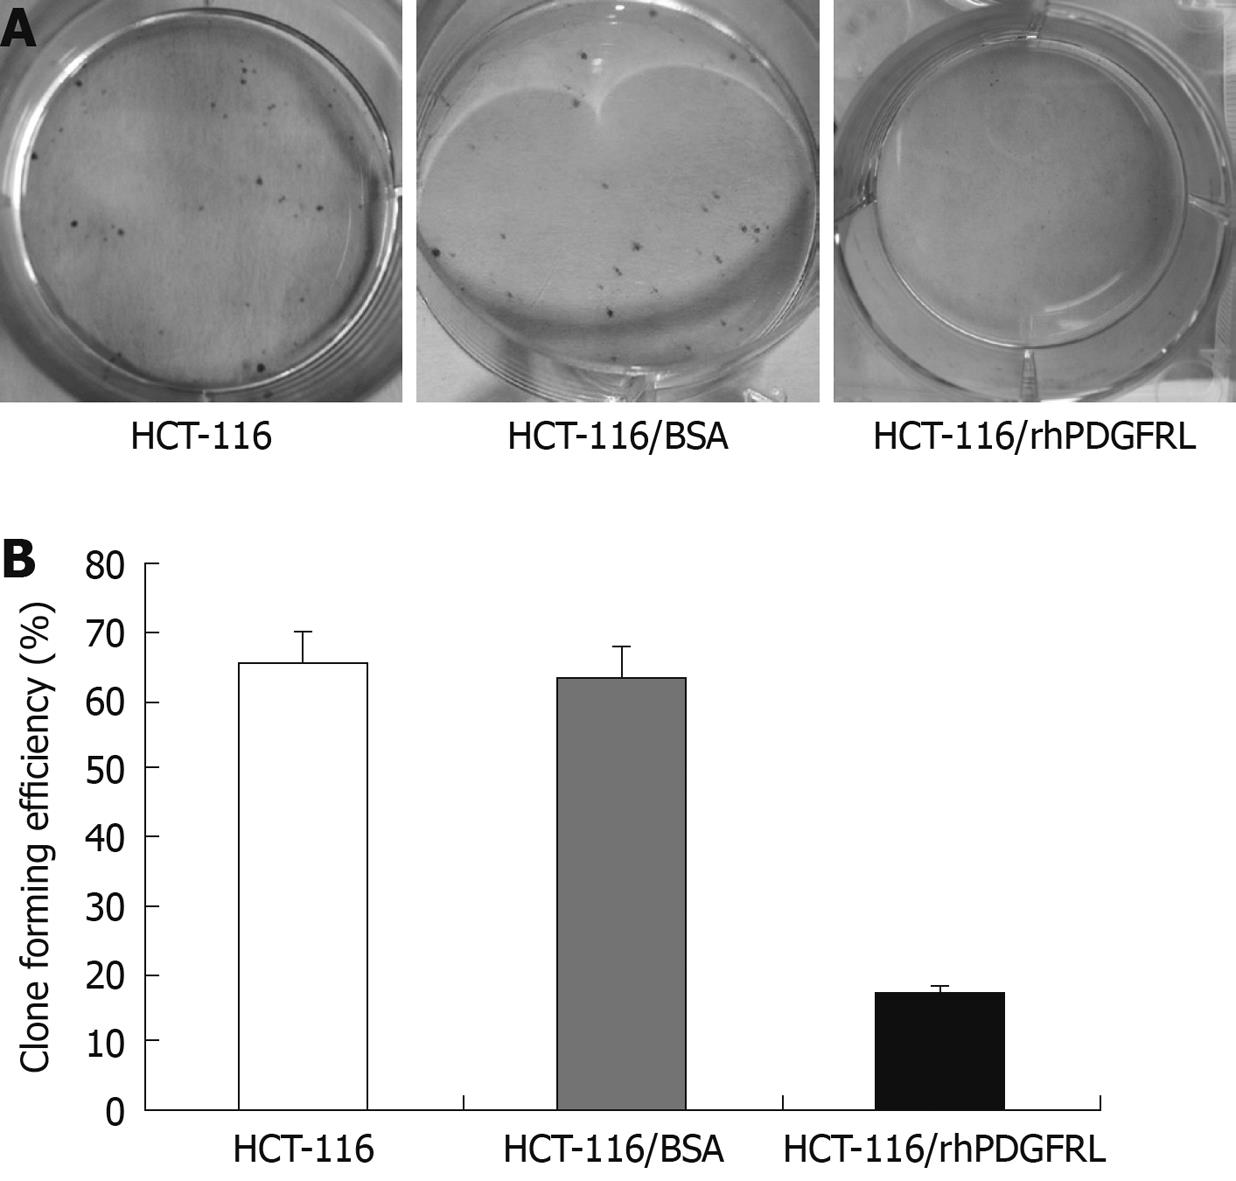
Figure 6 Crystal violet (CV) staining of cells and clone counting assay.
A: CV staining of HCT-116 cells; B: Quantitative analysis of colony formation. Data are expressed as the efficiency of colony formation (%) and expressed as the mean ± SD of three separated experiments, P < 0.05, HCT-116/rhPDGFRL vs HCT-116/BSA.
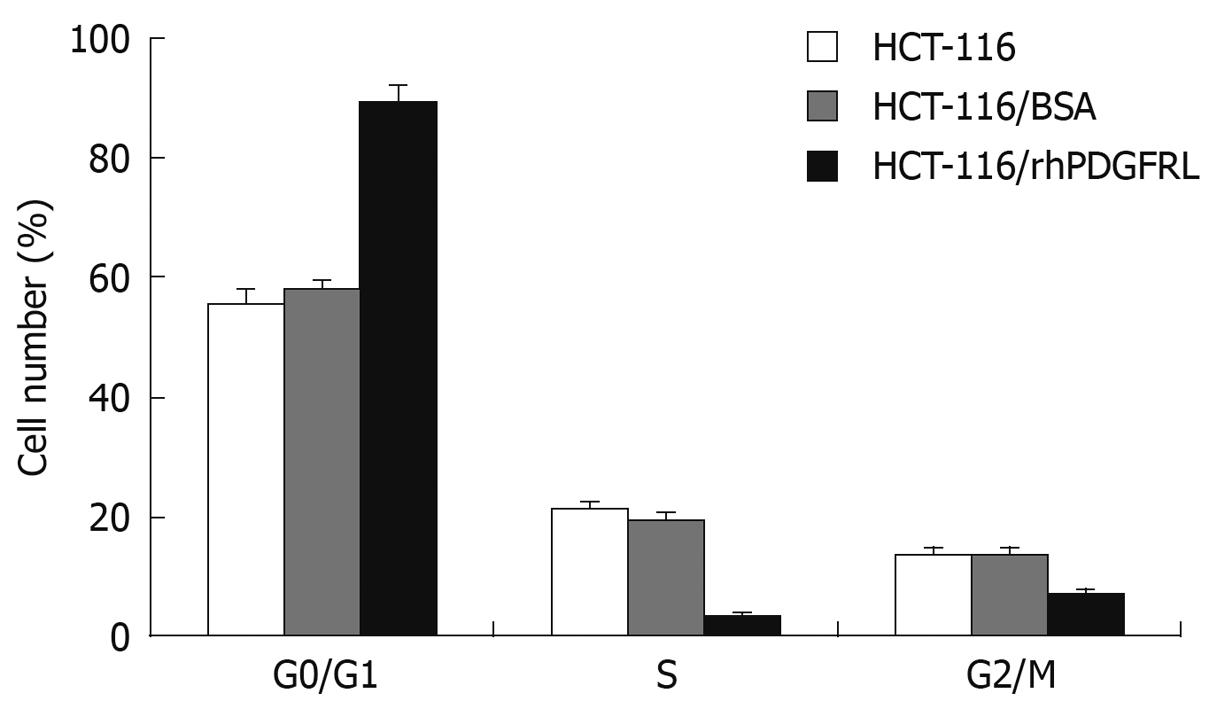
Figure 7 Analysis of cell cycle.
HCT-116, HCT-116/BSA, and HCT-116/rhPDGFRL cells were fixed with 70% ethanol and stained with PI, followed by FACS analysis. Data are expressed as mean ± SD of three independent experiments, P < 0.05, HCT-116/rhPDGFRL vs HCT-116/BSA.
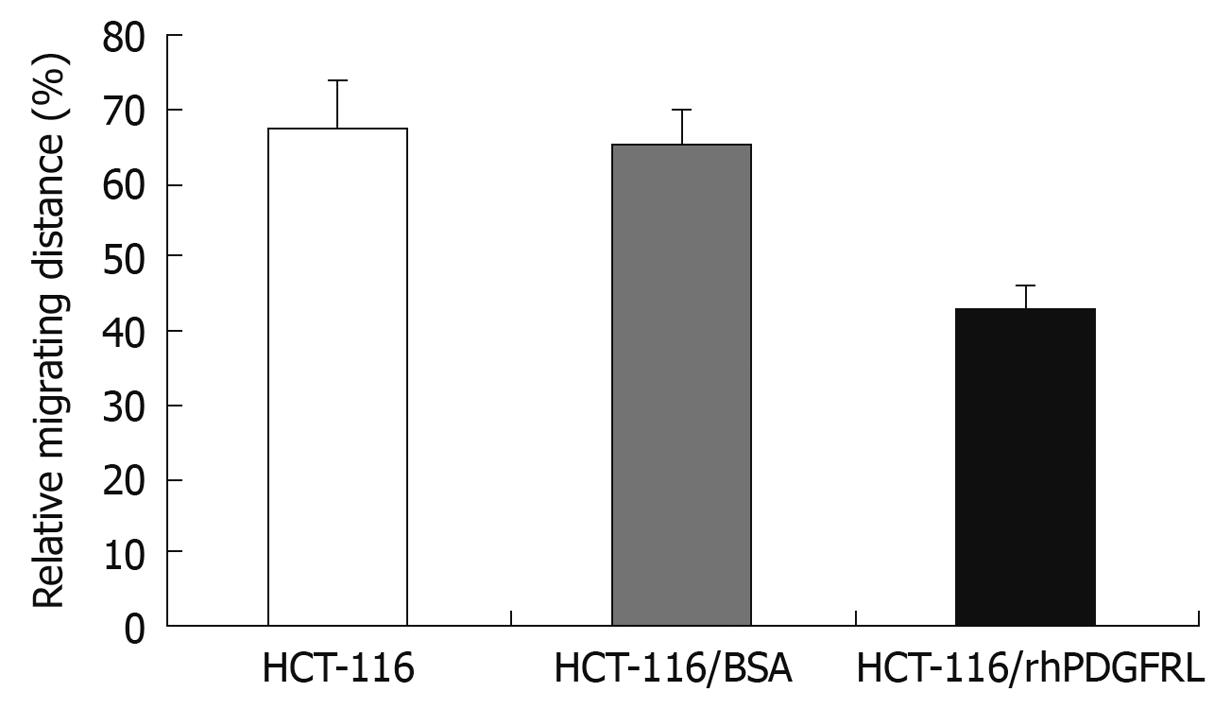
Figure 8 Measurement of migration distance in HCT-116, HCT-116/BSA, and HCT-116/rhPDGFRL cells.
Data are expressed as the mean ± SD of three independent experiments, P < 0.05, HCT-116/rhPDGFRL vs HCT-116/BSA.
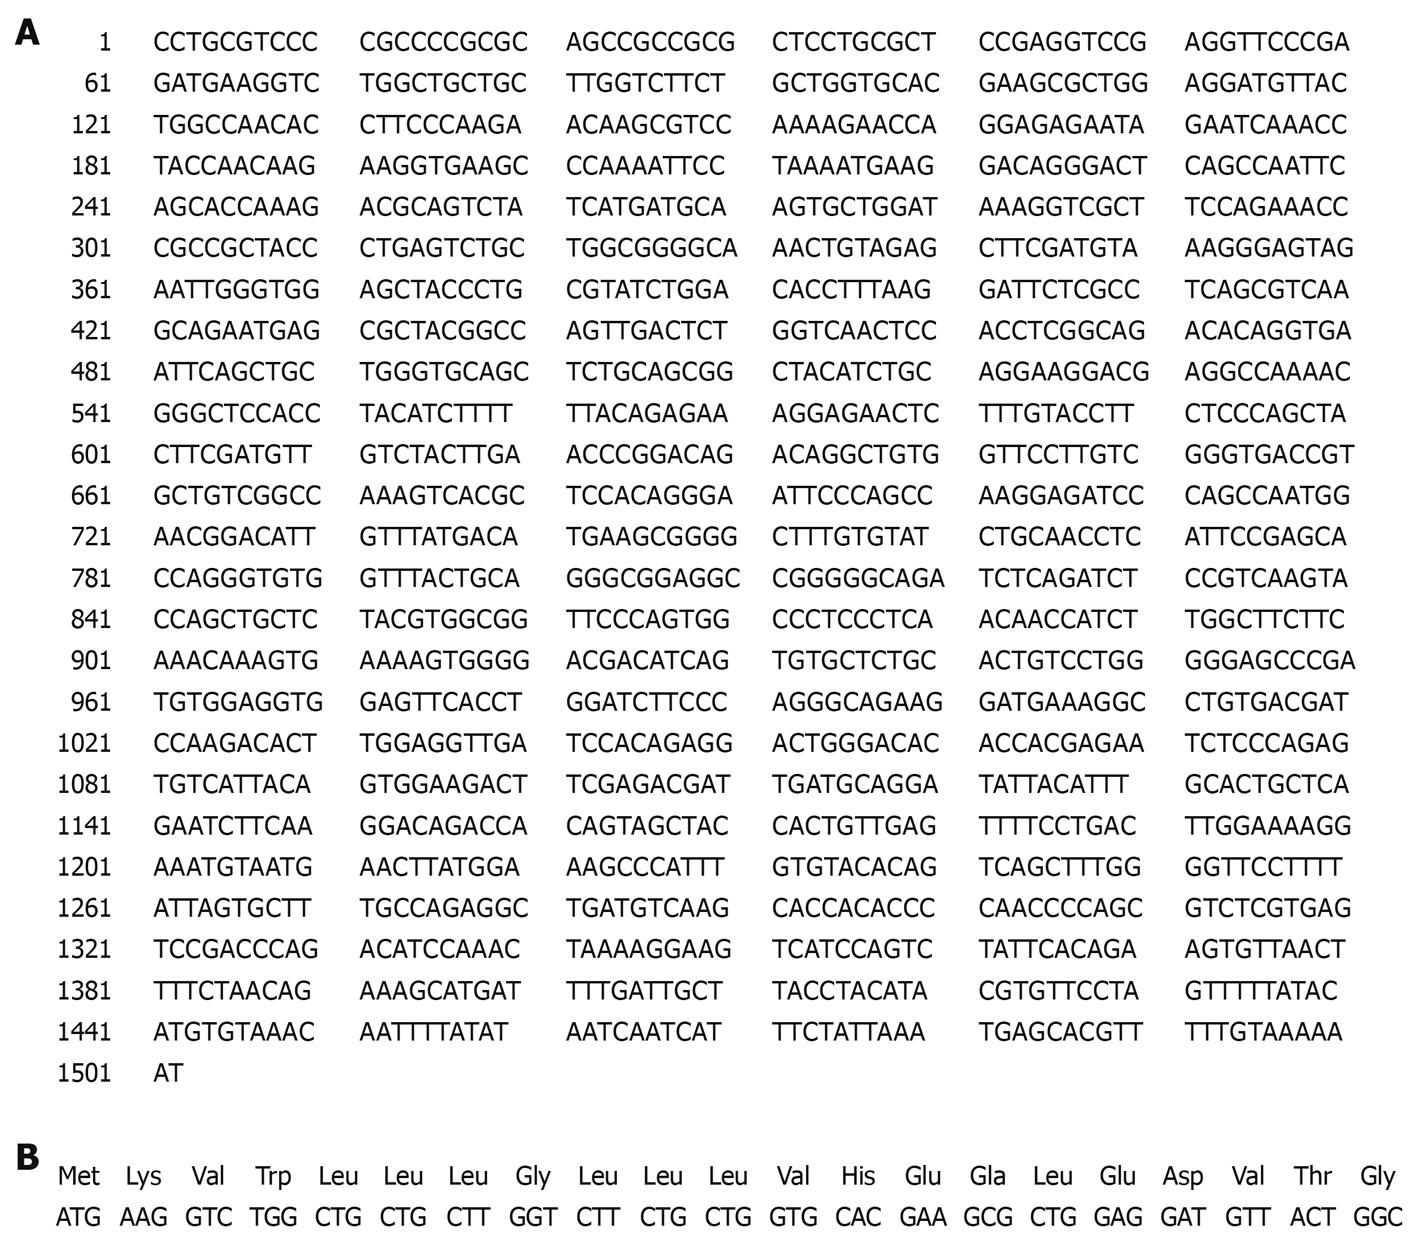
Figure 9 PDGFRL protein contains a putative signal peptide of 21aa.
A: PDGFRL cDNA sequences contain an open reading frame (ORF) of 1128-base pairs that is matched in bold; B: ORF encodes a protein of 375 amino acids (aa) with a putative signal peptide of 21aa.
- Citation: Guo FJ, Zhang WJ, Li YL, Liu Y, Li YH, Huang J, Wang JJ, Xie PL, Li GC. Expression and functional characterization of platelet-derived growth factor receptor-like gene. World J Gastroenterol 2010; 16(12): 1465-1472
- URL: https://www.wjgnet.com/1007-9327/full/v16/i12/1465.htm
- DOI: https://dx.doi.org/10.3748/wjg.v16.i12.1465


