Copyright
©2010 Baishideng.
World J Gastroenterol. Mar 28, 2010; 16(12): 1465-1472
Published online Mar 28, 2010. doi: 10.3748/wjg.v16.i12.1465
Published online Mar 28, 2010. doi: 10.3748/wjg.v16.i12.1465
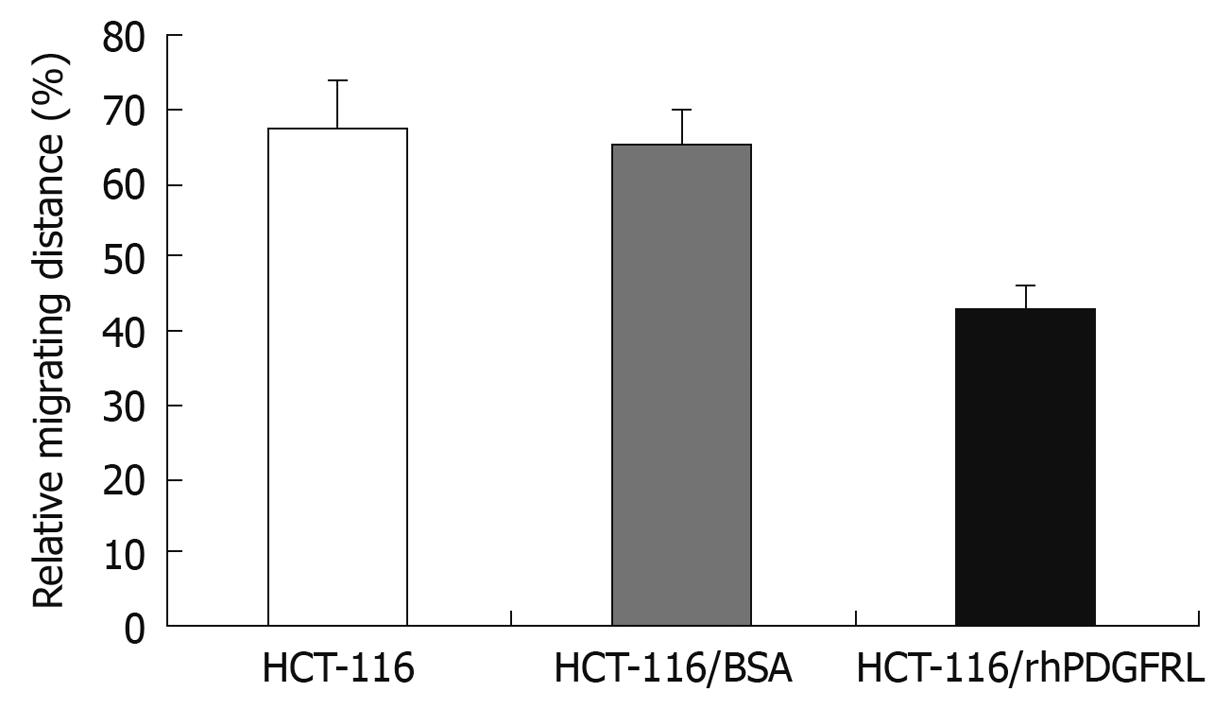
Figure 8 Measurement of migration distance in HCT-116, HCT-116/BSA, and HCT-116/rhPDGFRL cells.
Data are expressed as the mean ± SD of three independent experiments, P < 0.05, HCT-116/rhPDGFRL vs HCT-116/BSA.
- Citation: Guo FJ, Zhang WJ, Li YL, Liu Y, Li YH, Huang J, Wang JJ, Xie PL, Li GC. Expression and functional characterization of platelet-derived growth factor receptor-like gene. World J Gastroenterol 2010; 16(12): 1465-1472
- URL: https://www.wjgnet.com/1007-9327/full/v16/i12/1465.htm
- DOI: https://dx.doi.org/10.3748/wjg.v16.i12.1465


