Copyright
©2010 Baishideng.
World J Gastroenterol. Mar 14, 2010; 16(10): 1215-1220
Published online Mar 14, 2010. doi: 10.3748/wjg.v16.i10.1215
Published online Mar 14, 2010. doi: 10.3748/wjg.v16.i10.1215
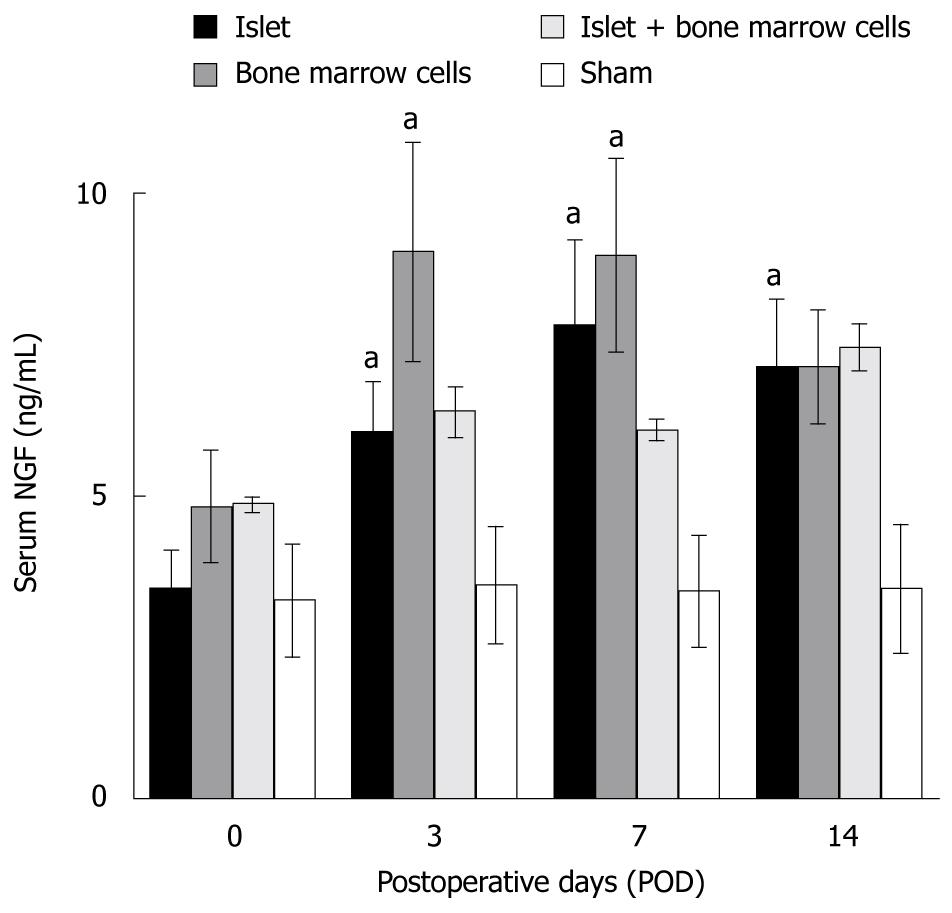
Figure 1 Serum nerve growth factor (NGF) data.
Serum NGF levels increased post-transplantation in islet, bone marrow, and islet + bone marrow groups, while there was no increase in the sham group. There was a significant difference between bone marrow and sham group. Statistical analysis was performed by two ways repeated measurement ANOVA and significant difference was aP < 0.05 vs POD 0.
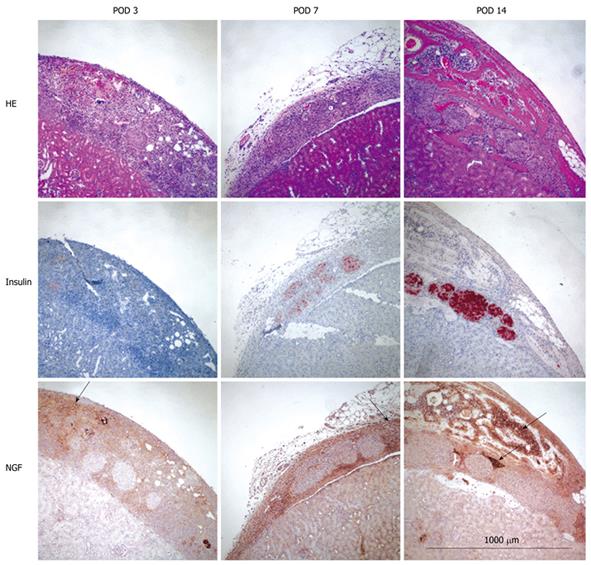
Figure 2 Histological findings.
Kidney specimen from islet + bone marrow group stained with HE (top), Insulin (middle) and NGF (bottom) at POD 3, 7 and 14. Bone marrow cells stained strongly for NGF compared to islets at all time points (indicated by arrow). Magnification = 100 ×, Calibration bar = 1000 μm.
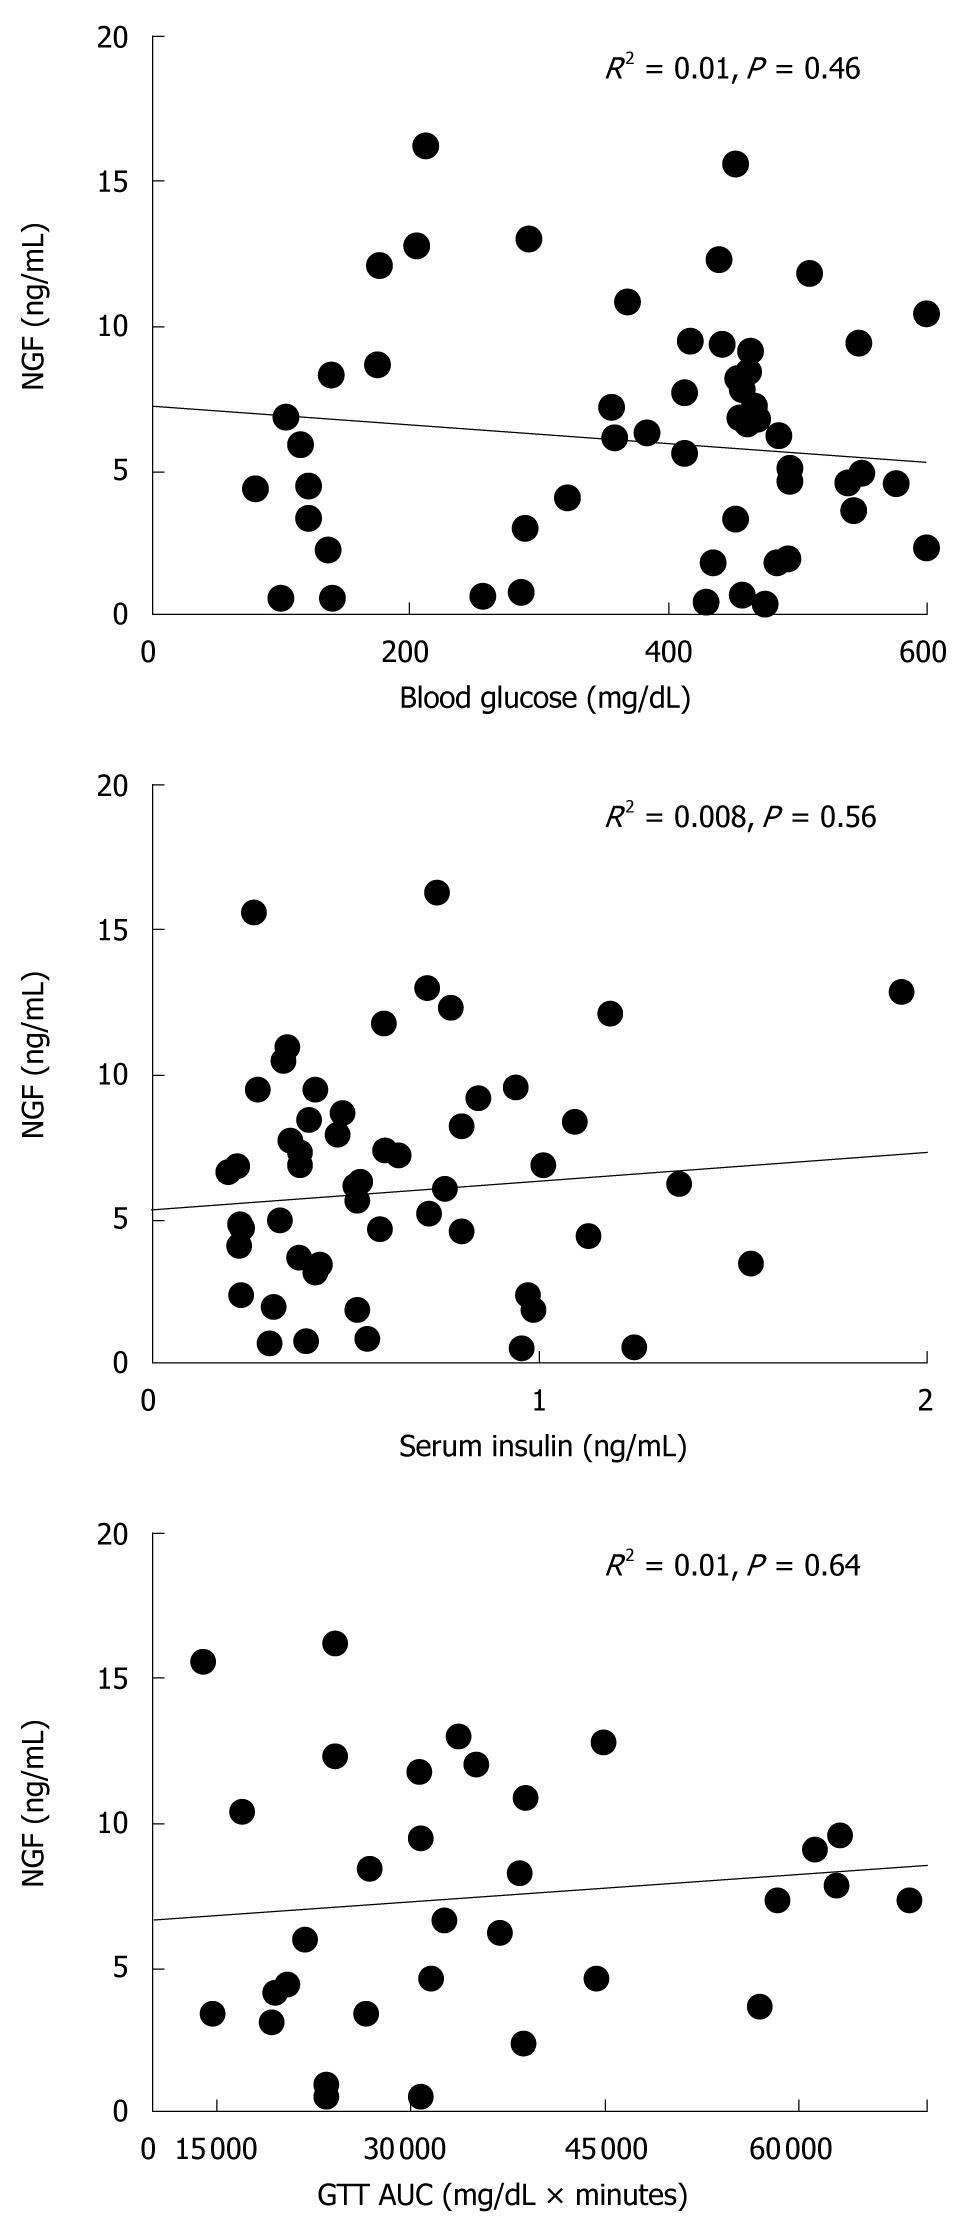
Figure 3 Correlation between serum NGF and blood glucose, serum insulin and GTT AUC.
There were no correlation between serum NGF and other islet functional factors. R2 > 0.25 and P < 0.05 is significant correlation.
- Citation: Sakata N, Chan NK, Chrisler J, Obenaus A, Hathout E. Bone marrow cells produce nerve growth factor and promote angiogenesis around transplanted islets. World J Gastroenterol 2010; 16(10): 1215-1220
- URL: https://www.wjgnet.com/1007-9327/full/v16/i10/1215.htm
- DOI: https://dx.doi.org/10.3748/wjg.v16.i10.1215


