Copyright
©2009 The WJG Press and Baishideng.
World J Gastroenterol. Mar 7, 2009; 15(9): 1079-1084
Published online Mar 7, 2009. doi: 10.3748/wjg.15.1079
Published online Mar 7, 2009. doi: 10.3748/wjg.15.1079
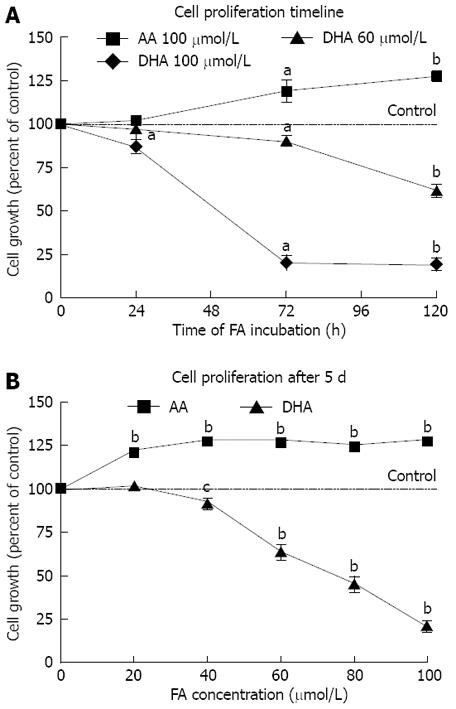
Figure 1 Effects of fatty acids on cellular viability.
A: Growth of LS-174T cells during incubation with different concentrations of fatty acids in the medium with 1 mg/mL BSA. Data points represent at least five independent experiments. aP < 0.05 versus control, bP < 0.001 versus control. B: Concentration-dependent effect of DHA and AA on growth of LS-174T colon cancer cells after 5 d incubation. Data points represent at least 13 independent experiments. cP < 0.01 versus control, bP < 0.001 versus control.
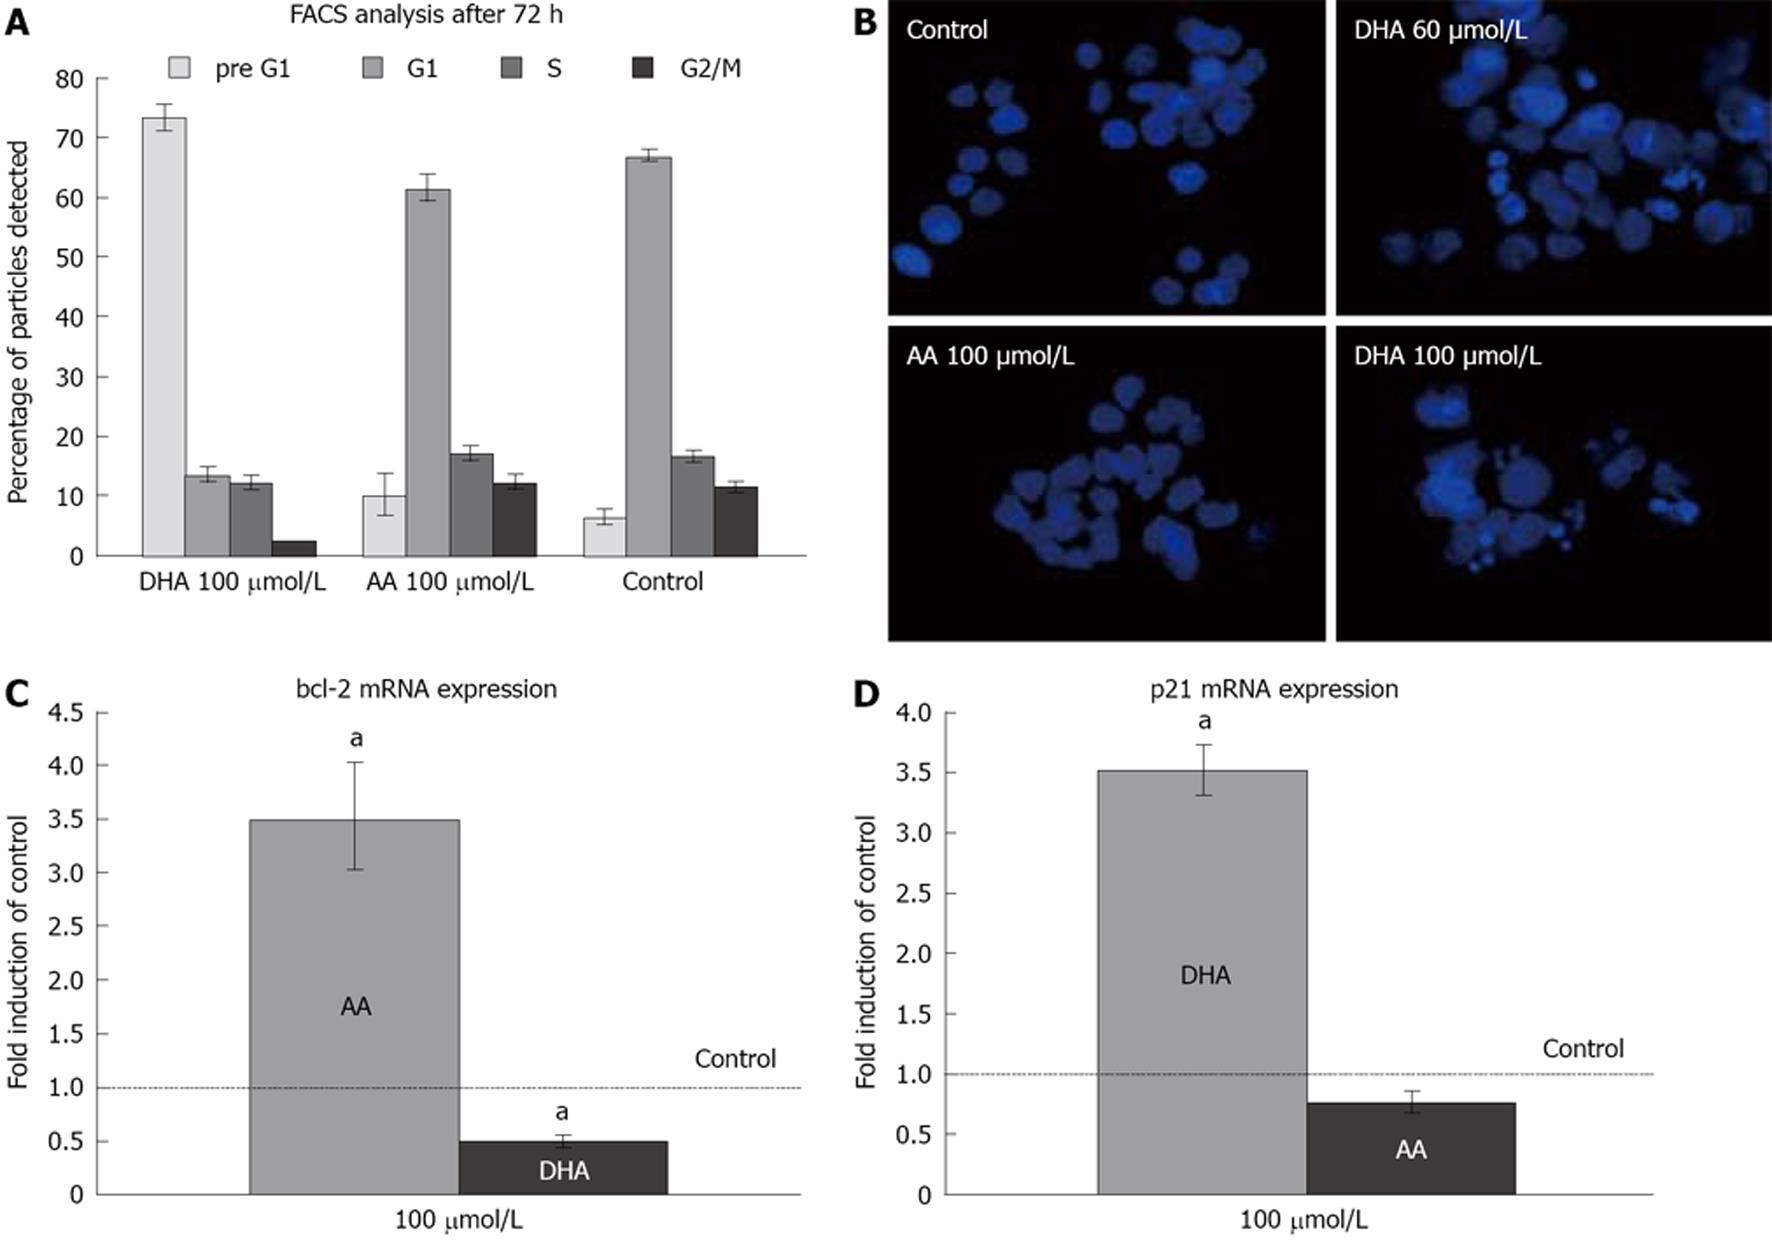
Figure 2 Effect of DHA and AA on cell cycle and apoptosis.
A: Cell cycle analysis by flow cytometry. Induction of apoptosis is indicated by an increased pre-G1 fraction. Results represent five independent experiments. B: DAPI staining of LS-174T cells incubated with different concentrations of AA and DHA showed a clear increase of apoptotic bodies in cells incubated with DHA. C: RT-PCR demonstrated induction of bcl-2 expression by AA, while DHA suppressed bcl-2 mRNA expression. aP < 0.01 versus control. n = 3 for each group. D: DHA induced transcription of p21, while AA did not alter p21 mRNA formation. aP < 0.01 versus control. n = 3 for each group.
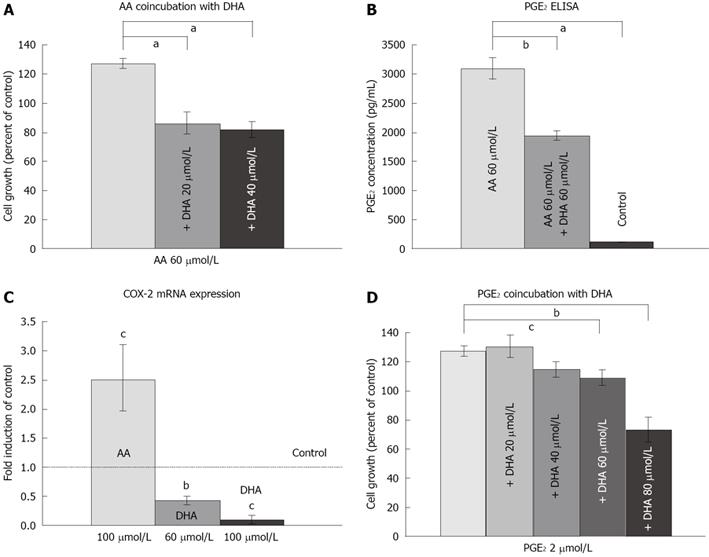
Figure 3 DHA suppresses AA- and PGE2-induced proliferation.
A: DHA inhibited AA-induced proliferation, aP < 0.001. Results represent six independent experiments. B: PGE2 formation was induced by AA treatment and was suppressed by concomitant DHA incubation, aP < 0.001, bP < 0.01. Results represent the mean of PGE2 measurements from three independent samples. C: COX-2 transcription was activated by AA, but suppressed by DHA. cP < 0.05 versus control, bP < 0.01 versus control. Bars represent at least three experiments. D: DHA suppressed PGE2-induced cell proliferation, cP < 0.05, bP < 0.01. Results represent five independent experiments.
- Citation: Habbel P, Weylandt KH, Lichopoj K, Nowak J, Purschke M, Wang JD, He CW, Baumgart DC, Kang JX. Docosahexaenoic acid suppresses arachidonic acid-induced proliferation of LS-174T human colon carcinoma cells. World J Gastroenterol 2009; 15(9): 1079-1084
- URL: https://www.wjgnet.com/1007-9327/full/v15/i9/1079.htm
- DOI: https://dx.doi.org/10.3748/wjg.15.1079


