Copyright
©2009 The WJG Press and Baishideng.
World J Gastroenterol. Feb 21, 2009; 15(7): 865-870
Published online Feb 21, 2009. doi: 10.3748/wjg.15.865
Published online Feb 21, 2009. doi: 10.3748/wjg.15.865
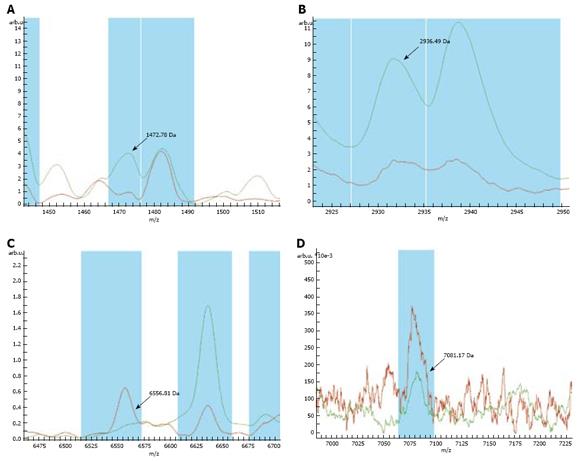
Figure 1 Sample spectrum showing a lower average peak value for proteins 1472.
78 Da (A) and 2936.49 Da (B) in the normal group than in the gastric cancer group, and a higher value for proteins 6556.81 Da (C) and 7081.17 Da (D) in the normal group than in the gastric cancer group. Red line: Normal group; Green line: Gastric cancer group.
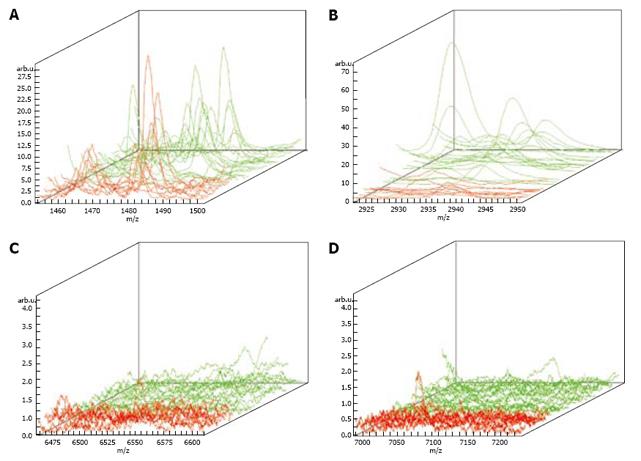
Figure 2 Three-dimensional map showing a lower average peak value for proteins 1472.
78 Da (A) and 2936.49 Da (B) in normal group than in gastric cancer group, and a higher value for proteins 6556.81 Da (C) and 7081.17 Da (D) in normal group in gastric cancer group. Red line: Normal group; Green line: Gastric cancer group.
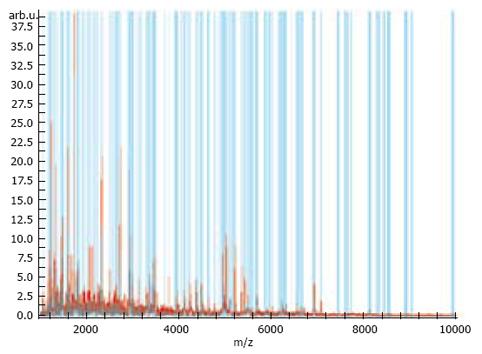
Figure 3 Complete mass spectrum of proteins 1472.
78 Da, 2936.49 Da, 6556.81 Da and 7081.17 Da, respectively.
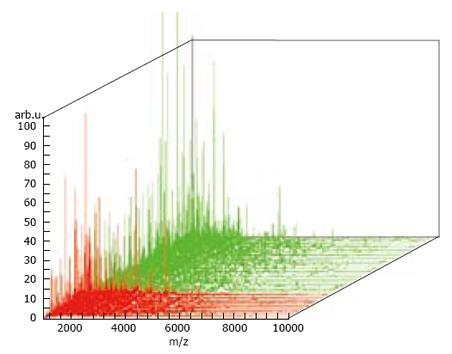
Figure 4 Complete three-dimensional mass spectrum of proteins 1472.
78 Da, 2936.49 Da, 6556.81 Da and 7081.17 Da, respectively. Red line: Normal group; Green line: Gastric cancer group.
- Citation: Wu ZZ, Wang JG, Zhang XL. Diagnostic model of saliva protein finger print analysis of patients with gastric cancer. World J Gastroenterol 2009; 15(7): 865-870
- URL: https://www.wjgnet.com/1007-9327/full/v15/i7/865.htm
- DOI: https://dx.doi.org/10.3748/wjg.15.865


