Copyright
©2009 The WJG Press and Baishideng.
World J Gastroenterol. Feb 21, 2009; 15(7): 845-848
Published online Feb 21, 2009. doi: 10.3748/wjg.15.845
Published online Feb 21, 2009. doi: 10.3748/wjg.15.845
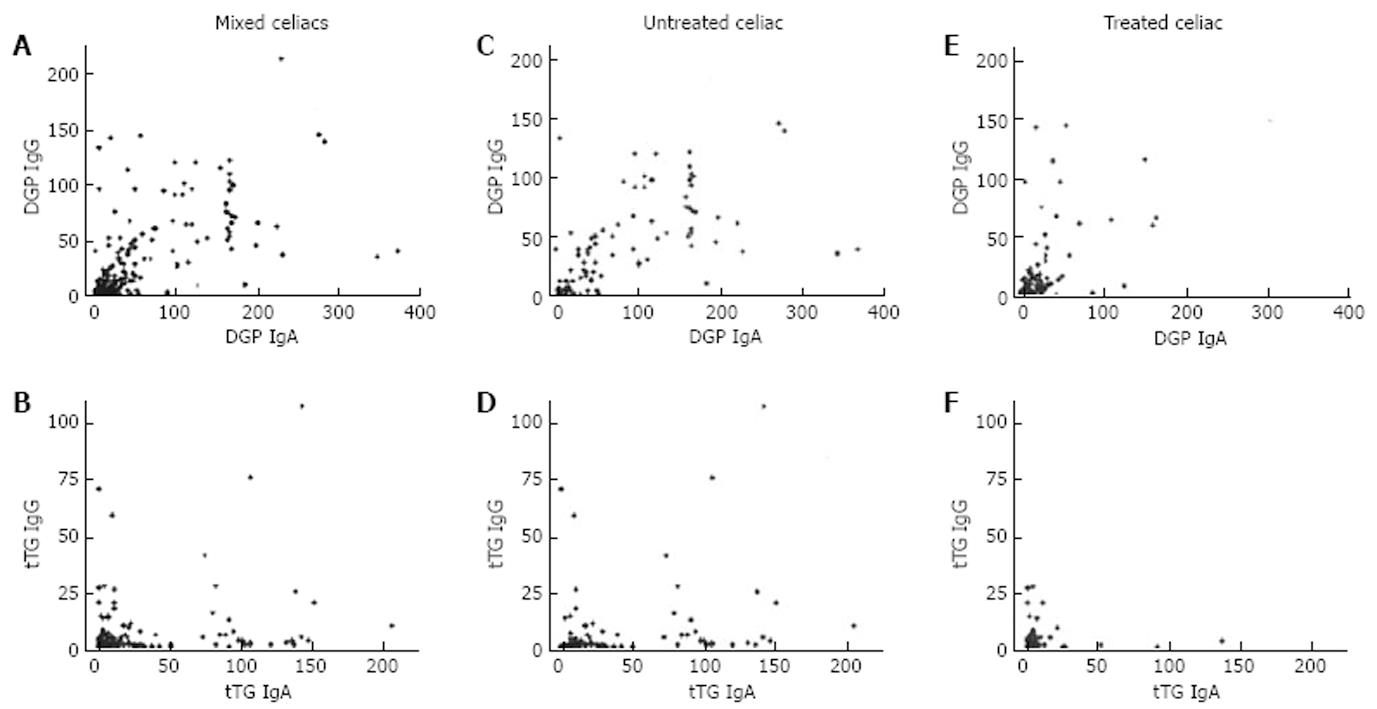
Figure 1 Effect of diet upon isotype correlations.
The titers of IgG and IgA against DGP and tTG were evaluated and plotted against each other for celiac patients. For mixed (treated and untreated) celiac patients, the Spearman’s rank correlation coefficients were r = 0.75 for DGP (A) and r = 0.52 for tTG (B). For untreated celiac patients, r = 0.78 for DGP (C) and r = 0.60 for tTG (D). For treated celiac patients, r = 0.58 for DGP (E) and r = 0.44 for tTG (F).
Figure 2 Comparing anti-tTG IgA and IgG production with anti-DGP IgA and IgG.
The titers of anti-tTG IgA (A-B) and anti-tTG IgG (C-D) were compared with the titers of anti-DGP IgA (A and C) as well as anti-DGP IgG (B and D) in all treated and untreated celiac patients. Spearman’s rank correlation coefficients were 0.80 (A), 0.67 (B), 0.38 (C), and 0.43 (D).
- Citation: Marietta EV, Rashtak S, Murray JA. Correlation analysis of celiac sprue tissue transglutaminase and deamidated gliadin IgG/IgA. World J Gastroenterol 2009; 15(7): 845-848
- URL: https://www.wjgnet.com/1007-9327/full/v15/i7/845.htm
- DOI: https://dx.doi.org/10.3748/wjg.15.845


