Copyright
©2009 The WJG Press and Baishideng.
World J Gastroenterol. Feb 7, 2009; 15(5): 561-569
Published online Feb 7, 2009. doi: 10.3748/wjg.15.561
Published online Feb 7, 2009. doi: 10.3748/wjg.15.561
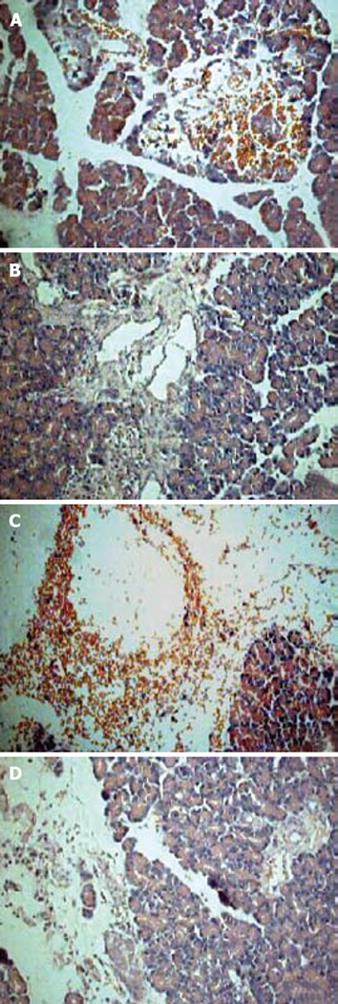
Figure 1 Tat-NBD attenuates STC-induced pancreatitis (HE, × 200).
A: STC group at 6 h; B: Tat-NBD (WT) group at 6 h; C: STC group at 12 h; D: Tat-NBD (WT) group at 12 h.
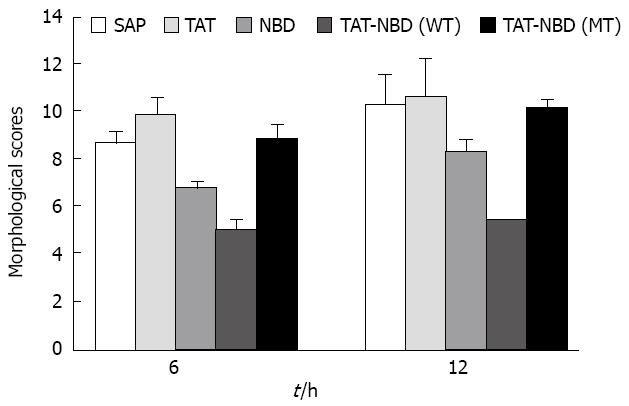
Figure 2 Pancreas histopathologic scores.
The pretreatment of NBD peptide and Tat-NBD (WT) resulted in a significant reduction of the tissue damage score and more beneficial effect can be seen in the latter group at the two time points. Pretreatment with Tat or Tat-NBD (MT) peptide showed no therapeutic effect.
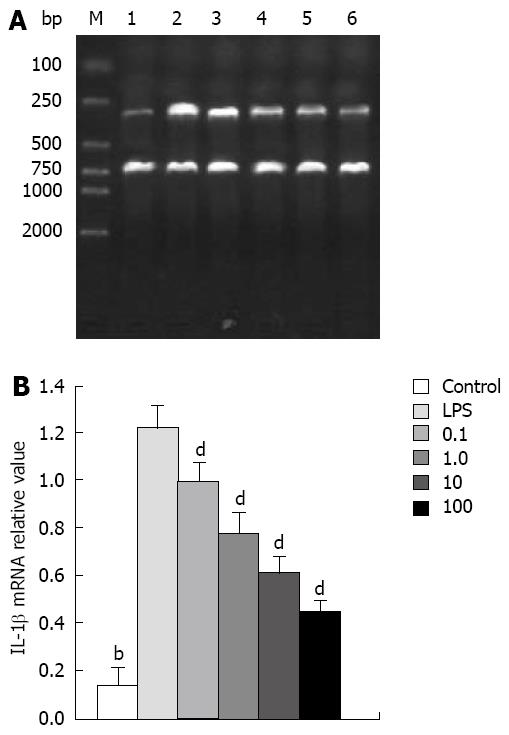
Figure 3 Effects different doses of Tat-NBD (WT) in IL-1β mRNA expression of AR42J by RT-PCR.
A: Images of agarose gel electrophoresis; B: Tat-NBD (WT) peptide decreased IL-1β mRNA expression in a dose-dependent manner and its peak role appeared at a dose of 100 mg/L. Control: Cells were incubated with buffer control (n = 3); 1: Control; 2: LPS; 3: 0.1 mg/L Tat-NBD (WT); 4: 1 mg/L Tat-NBD (WT); 5: 10 mg/L Tat-NBD (WT); 6: 100 mg/L Tat-NBD (WT); M: Marker. LPS: Cells stimulated by LPS for 2 h (n = 3). 0.1: Pretreatment with 0.1 mg/L of Tat-NBD (WT) (n = 3); 1: Pretreatment with 1 mg/L of Tat-NBD (WT) (n = 3); 10: Pretreatment with 10 mg/L of Tat-NBD (WT) (n = 3); 100: Pretreatment with 100 mg/L of Tat-NBD (WT) (n = 3). bP < 0.01 vs LPS group. dP < 0.01 vs LPS group.
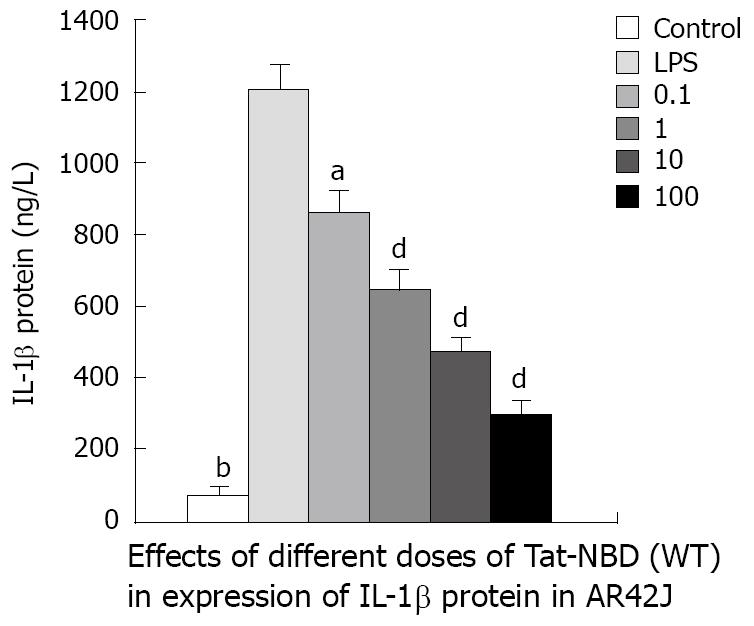
Figure 4 Effects of different doses of Tat-NBD (WT) in IL-1β protein expression of AR42J by ELISA.
TAT-NBD (WT) decreased IL-1β protein in a dose-dependent fashion over a range of 0.1 to 100 mg/L. Control: Cells were incubated with buffer control (n = 3); LPS: Cells were stimulated by LPS for 2 h (n = 3). 0.1: Pretreatment with 0.1 mg/L of Tat-NBD (WT) (n = 3); 1: Pretreatment with 1 mg/L of Tat-NBD (WT) (n = 3); 10: Pretreatment with 10 mg/L of Tat-NBD (WT) (n = 3); 100: Pretreatment with 100 mg/L of Tat-NBD (WT) (n = 3). aP < 0.05, bP < 0.01, vs LPS group. dP < 0.01 vs LPS group.
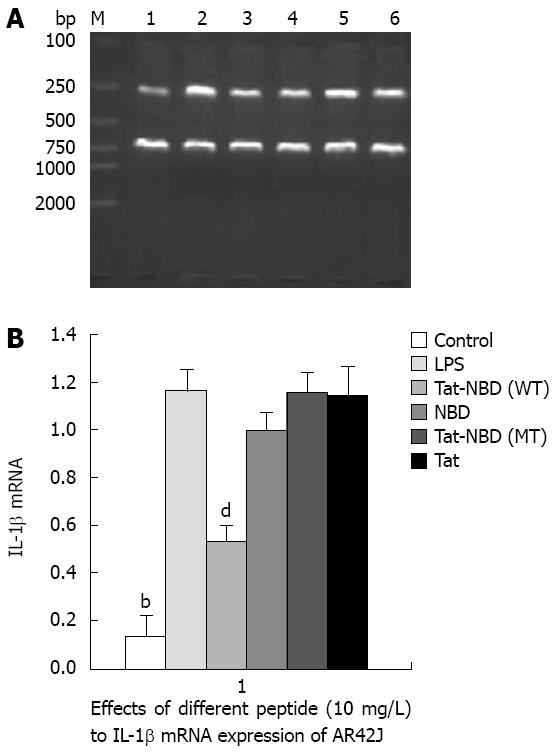
Figure 5 Effects of peptide at a dose of 10 mg/L in IL-1β mRNA expression in AR42J by RT-PCR.
A: Images of agarose gel electrophoresis; 1: Control; 2: LPS; 3: Tat-NBD (WT); 4: NBD; 5: Tat-NBD (MT); 6: Tat; M: Marker; B: Tat-NBD (WT) peptide decreased IL-1β mRNA expression. Control: Cells were incubated with buffer control (n = 3); LPS: Cells were stimulated by LPS for 2 h (n = 3). Tat-NBD (WT): Pretreatment with 10 mg/L of (n = 3); NBD: Pretreatment with 10 mg/L of NBD (n = 3); Tat-NBD (MT): Pretreatment with 10 mg/L of Tat-NBD (MT) (n = 3); Tat: Pretreatment with 100 mg/L of Tat (n = 3). bP < 0.01, vs LPS group. dP < 0.01 vs LPS group.
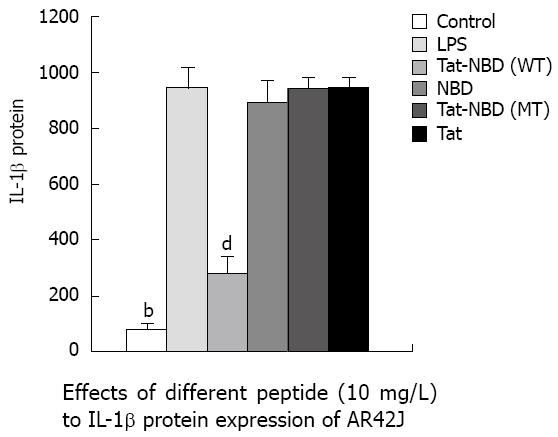
Figure 6 Effects of peptide at dose of 10 mg/L in IL-1β protein expression of AR42J.
Control: Cells were incubated with buffer control (n = 3); LPS: Cells were stimulated by LPS for 2 h (n = 3); Tat-NBD (WT): Pretreatment with 10 mg/L of (n = 3); NBD: Pretreatment with 10 mg/L of NBD (n = 3); Tat-NBD (MT): Pretreatment with 10 mg/L of Tat-NBD (MT) (n = 3); Tat: Pretreatment with 100 mg/L of Tat (n = 3). bP < 0.01, vs LPS group. dP < 0.01 vs LPS group.
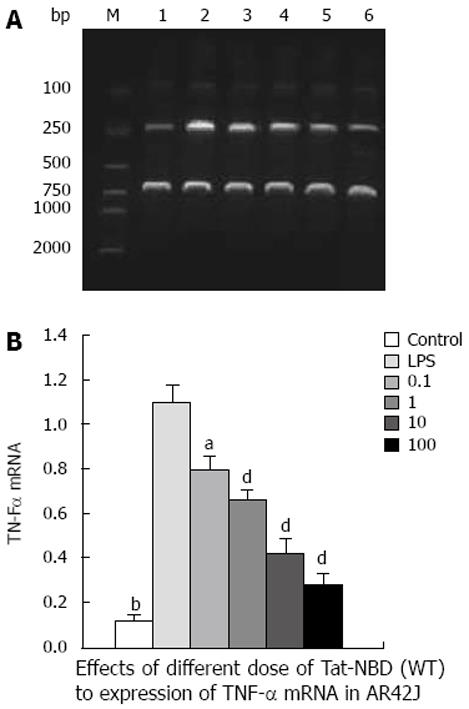
Figure 7 Effects of Tat-NBD (WT) in TNF-α mRNA expression of AR42J by RT-PCR.
A: Images of agarose gel electrophoresis; 1: Control; 2: LPS; 3: 0.1 mg/L Tat-NBD (WT); 4: 1 mg/L Tat-NBD (WT); 5: 10 mg/L Tat-NBD (WT); 6: 100 mg/L Tat-NBD (WT); M: Marker; B: TAT-NBD (WT) decreased TNF-α protein in a dose-dependent fashion over a range of 0.1 to 100 mg/L. Control: Cells were incubated with buffer control (n = 3); LPS: Cells were stimulated by LPS for 2 h (n = 3). 0.1: Pretreatment with 0.1 mg/L of Tat-NBD (WT) (n = 3); 1: Pretreatment with 1 mg/L of Tat-NBD (WT) (n = 3); 10: Pretreatment with 10 mg/L of Tat-NBD (WT) (n = 3); 100: Pretreatment with 100 mg/L of Tat-NBD (WT) (n = 3). aP < 0.05, bP < 0.01, vs LPS group. dP < 0.01 vs LPS group.
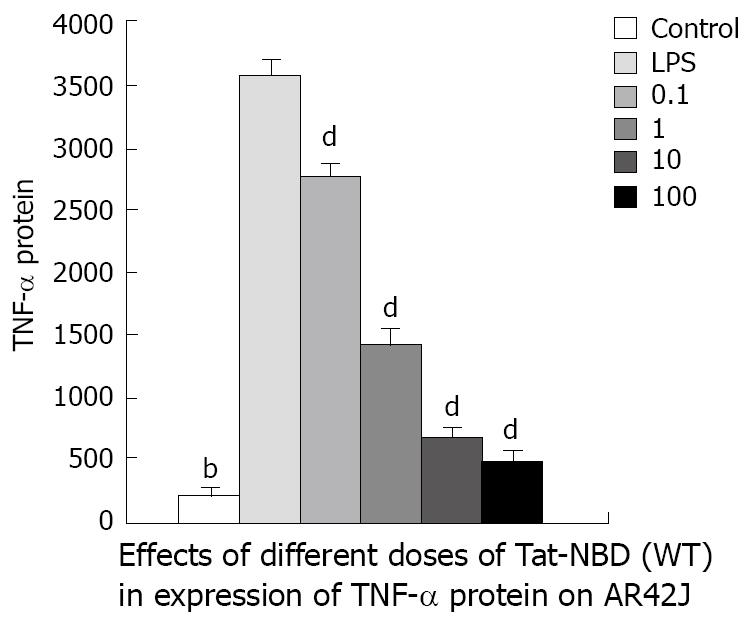
Figure 8 Effects of Tat-NBD (WT) in TNF-α protein expression of AR42J by ELISA.
TAT-NBD (WT) decreased TNF-α protein in a dose-dependent fashion over a range of 0.1 to 100 mg/L. Control: Cells were incubated with buffer control (n = 3); LPS: Cells were stimulated by LPS for 2 h (n = 3). 0.1: Pretreatment with 0.1 mg/L of Tat-NBD (WT) (n = 3); 1: Pretreatment with 1 mg/L of Tat-NBD (WT) (n = 3); 10: Pretreatment with 10 mg/L of Tat-NBD (WT) (n = 3); 100: Pretreatment with 100 mg/L of Tat-NBD (WT) (n = 3). bP < 0.01, vs LPS group. dP < 0.01 vs LPS group.
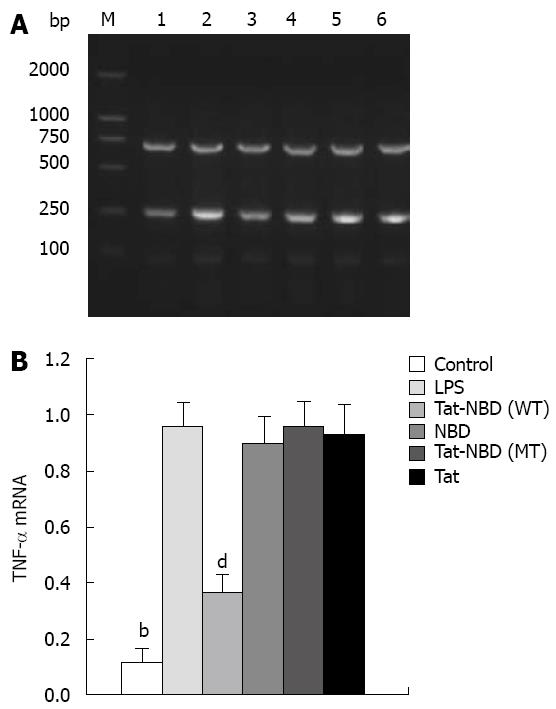
Figure 9 Effects of peptide at dose of 10 mg/L in TNF-α mRNA expression of AR42J by RT-PCR.
A: Images of agarose gel electrophoresis; 1: Control; 2: LPS; 3: Tat-NBD (WT); 4: NBD; 5: Tat-NBD (MT); 6: Tat; M: Marker; B: only Tat-NBD (WT) peptide decreased TNF-α mRNA expression. Control: Cells were incubated with buffer control (n = 3); LPS: Cells were stimulated by LPS for 2 h (n = 3); Tat-NBD (WT): Pretreatment with 10 mg/L of (n = 3); NBD: Pretreatment with 10 mg/L of NBD (n = 3); Tat-NBD (MT): Pretreatment with 10 mg/L of Tat-NBD (MT) (n = 3); Tat: Pretreatment with 100 mg/L of Tat (n = 3). bP < 0.01 vs LPS group. dP < 0.01 vs LPS group.
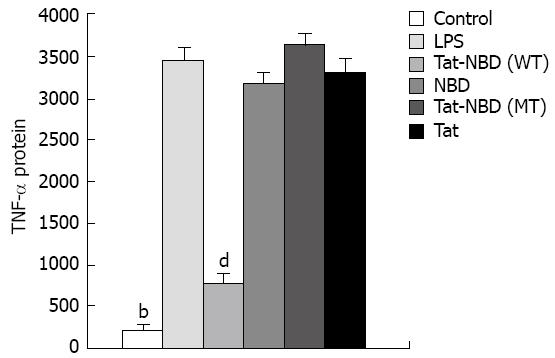
Figure 10 Effects of peptide at dose of 10 mg/L in TNF-α protein expression of AR42J.
Control: Cells were incubated with buffer control (n = 3); LPS: Cells were stimulated by LPS for 2 h (n = 3); Tat-NBD (WT): Pretreatment with 10 mg/L of (n = 3); NBD: Pretreatment with 10 mg/L of NBD (n = 3); Tat-NBD (MT): Pretreatment with 10 mg/L of Tat-NBD (MT) (n = 3); Tat: Pretreatment with 100 mg/L of Tat (n = 3). bP < 0.01 vs LPS group. dP < 0.01 vs LPS group.
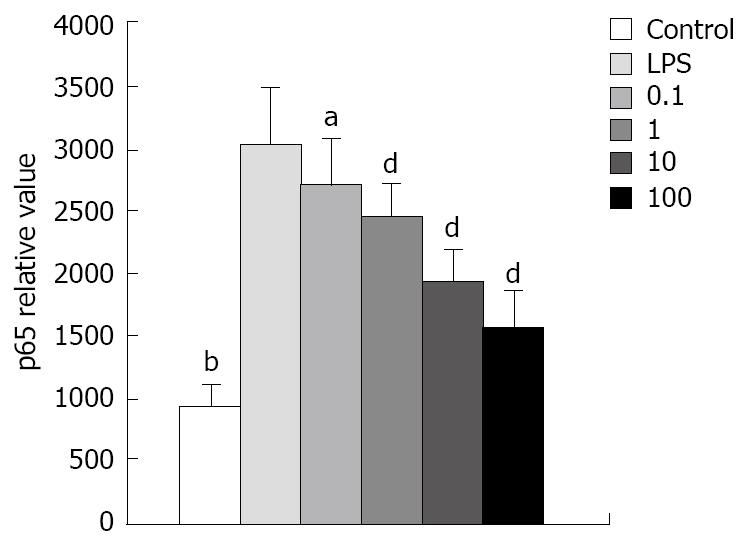
Figure 11 Effects of Tat-NBD (WT) in p65 protein expression of AR42J.
Control: Cells were incubated with buffer control (n = 10); LPS: Cells were stimulated by LPS for 2 h (n = 10). 0.1: Pretreatment with 0.1 mg/L of Tat-NBD (WT) (n = 10); 1: Pretreatment with 1 mg/L of Tat-NBD (WT) (n = 10); 10: pretreatment with 10 mg/L of Tat-NBD (WT) (n = 10); 100: Pretreatment with 100 mg/L of Tat-NBD (WT) (n = 10). aP < 0.05, bP < 0.01, vs LPS group. dP < 0.01 vs LPS group.
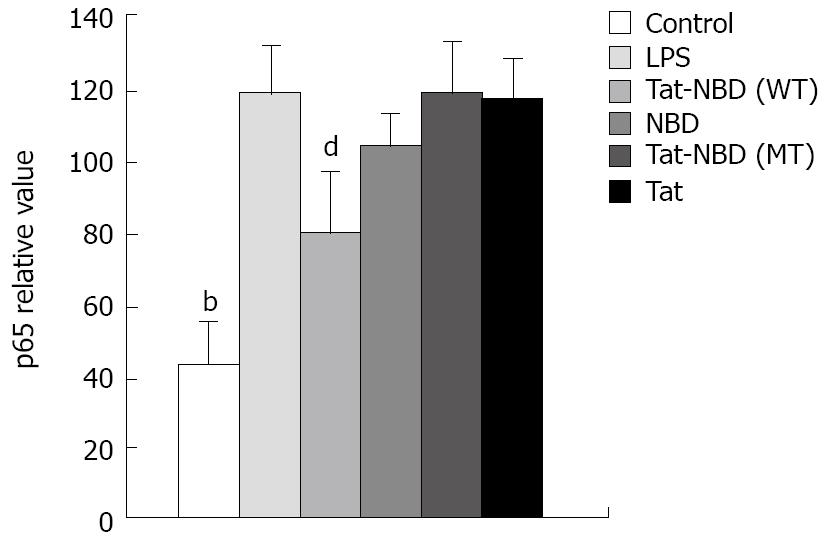
Figure 12 Effects of peptide at dose of 10 mg/L in p65 protein expression of AR42J.
Control: Cells were incubated with buffer control (n = 10); LPS: Cells were stimulated by LPS for 2 h (n = 10); Tat-NBD (WT): Pretreatment with 10 mg/L of (n = 10); NBD: Pretreatment with 10 mg/L of NBD (n = 10); Tat-NBD (MT): Pretreatment with 10 mg/L of Tat-NBD (MT) (n = 10); Tat: Pretreatment with 100 mg/L of Tat (n = 10). bP < 0.01 vs LPS group. dP < 0.01 vs LPS group.
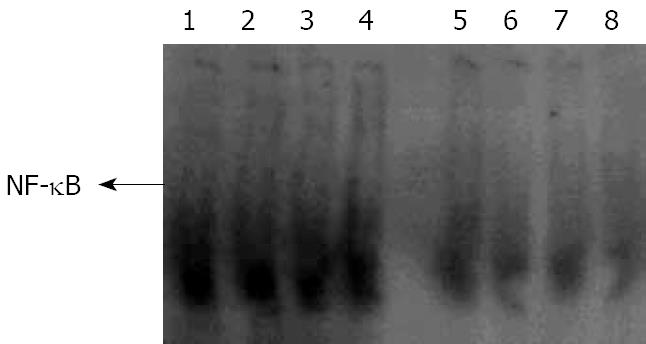
Figure 13 NF-κB activity was obviously activated after LPS induced AR42J (line 1).
After cells were pretreated with Tat-NBD (WT), the activity of NF-κB was markedly inhibited in a dose-dependent manner (line 5-8). No change in control peptide group (line 2-3); Lane 1-8: NF-κB activity in LPS group, Tat-NBD (MT) group, Tat group, NBD group, Tat-NBD (WT) group (0.1 mg/L, 1 mg/L, 10 mg/L and 100 mg/L respectively).
- Citation: Long YM, Chen K, Liu XJ, Xie WR, Wang H. Cell-permeable Tat-NBD peptide attenuates rat pancreatitis and acinus cell inflammation response. World J Gastroenterol 2009; 15(5): 561-569
- URL: https://www.wjgnet.com/1007-9327/full/v15/i5/561.htm
- DOI: https://dx.doi.org/10.3748/wjg.15.561


