Copyright
©2009 The WJG Press and Baishideng.
World J Gastroenterol. Feb 7, 2009; 15(5): 552-560
Published online Feb 7, 2009. doi: 10.3748/wjg.15.552
Published online Feb 7, 2009. doi: 10.3748/wjg.15.552
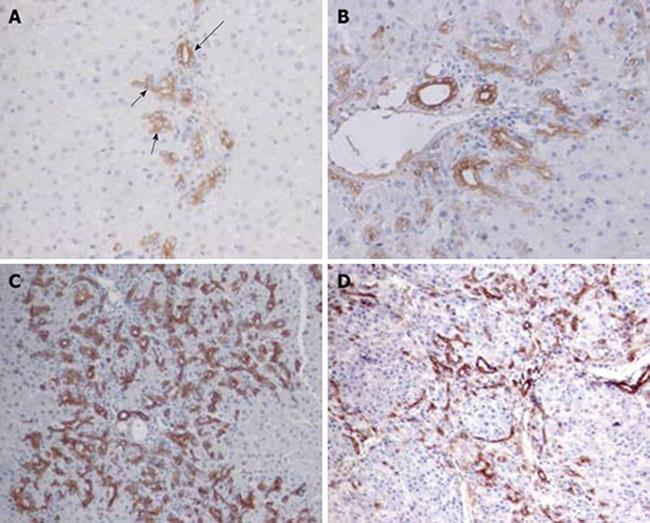
Figure 1 Ov-6 immunoreactivity of ductular cell reaction following PH of rats treated with AAF.
A: Oval cells (short arrow) close to hepatocytes at limiting plates on day 2 after PH show much lighter labeling than pre-existing bile duct cells (long arrow) (× 200); B: On day 4 after PH, strongly stained cells are beginning to move into the parenchyma (× 200); C: On day 9 after PH, apparent long cords of ductular oval cells are fanning outward from each portal area (× 100); D: On day 15, the ov-6 (+) ductular structures are restricted to the periphery of small hepatocyte nodus (× 100).
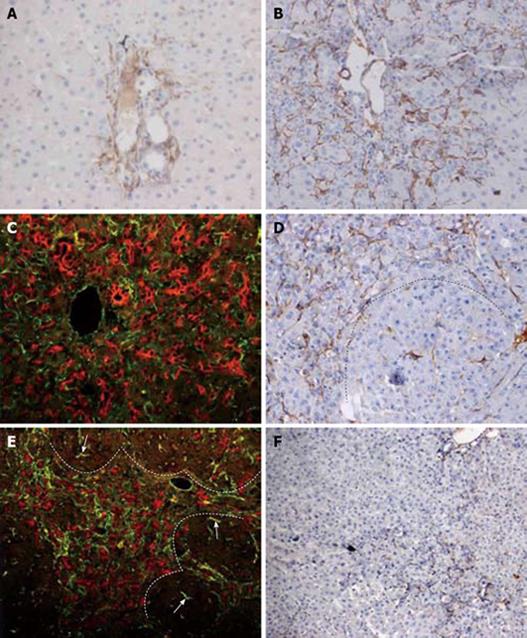
Figure 2 HSCs response and correlation with oval cell following PH of rats treated with AAF.
A: Increase in number of desmin positive stellate cells in the portal areas. Very few of HSCs were small interlobular sinusoidal cells on day 2 after PH (× 200); B: Further increase in number of stellate cells at the periphery of the portal areas at day 6 after PH (× 200); C: Double immunofluorescent labelling for ov-6 (red) and desmin (green) on day 9 after PH. The strings of ductular oval cells are closely surrounded by the mesh-like desmin (+) stellate cells (× 400); D: On day 12 after PH, dash line marks the edge of a regenerative small hepatocyte focus. Desmin (+) cells are present around the focus, and occasionally in the focus (× 200); E: Double immunofluorescent labelling for ov-6 (red) and desmin (green) on day 12 after PH. Desmin (+) cells accompany the ductular structure around small hepatocytes focus. There are few HSCs in the focus negative for ov-6 (× 200); F: By day 18 after PH, the number of desmin (+) portal stellate cells is further decreased ( ×100).
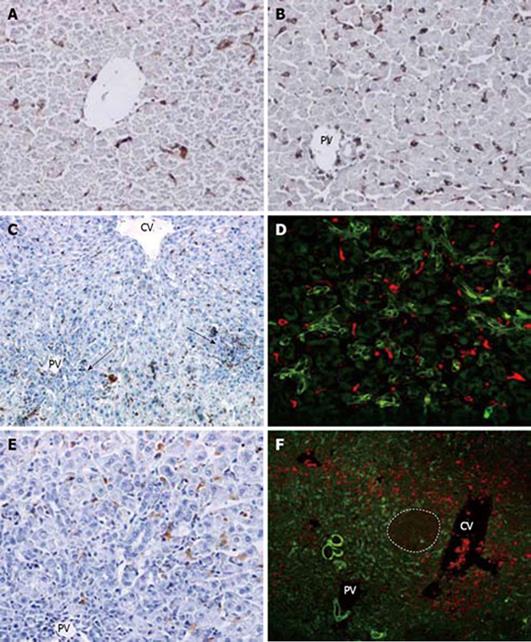
Figure 3 Kupffer cell response and correlation with oval cells following PH of rats treated with AAF.
A: Normal rat liver. Small round or spindle-like cells in the sinusoids are labelled (× 200); B: On day 2 after PH, there is marked increase of ED1 (+) cells in periporal and interlobular sinusoids. No oval cells are seen in the poral areas (× 200); C: on day 4 after PH, number of pericentral and periportal ED1 (+) cells decreased along with the ductular oval cells(arrows) (× 100); D: double immunofluorescent labelling for ov-6 (green) and ED1 (red) at day 4 after PH. A few scattered ED1 (+) cells around the portal appeared to admix with ov-6 (+) oval cell (× 400); E: on day 9 after PH, very few ED1 (+) cells are visualized in the periportal ductular oval cells (× 200); F: double immunofluorescent labelling for ov-6 (green) and ED1 (red) on day 12 after PH. Dash line marks the edge of a regenerative small hepatocyte nodus. ED1 (+) cells are situated around the small hepatocte nodus and ductular ov-6 (+) cells (× 100).
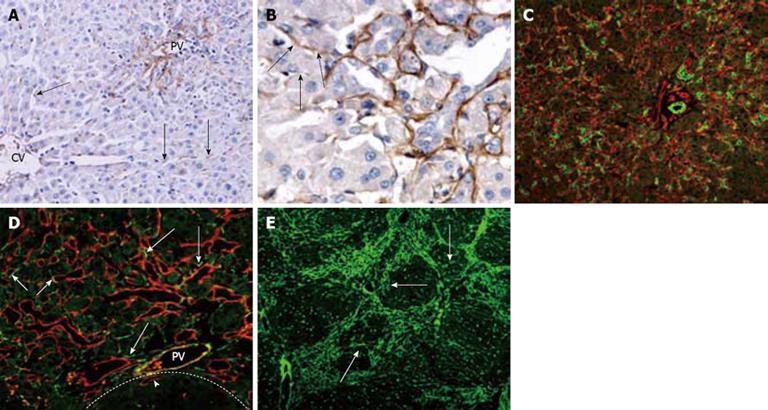
Figure 4 Laminin distribution and correlation with oval cell following PH of rats treated with AAF.
A: On day 2 after PH, laminin is present along hepatic sinusoids in peirportal areas and in the cytoplasm of few nonparenchymal cells in the lobule (arrows) (× 200); B: On day 6 after PH, laminin positivity around the ductular oval cells. The proximal part of the ductule has continuous laminin staining, whereas distally the basement membrane is fragmented or absent (arrows) (× 400); C: Periportal area stained for OV-6 (green) and laminin (red) 12 d after PH. The bifurcating ductule strongly positive for OV-6, is surrounded by continuous basement membrane (× 200); D: Portal area 15 d after PH, stained for laminin (red) and desmin (green). Some of the desmin-positive cells are positioned closely to the laminin (+) basement membrane of ductules (long arrows). Some of the laminin-positive ductules also stained positively for desmin (short arrows). The focus (dash line marks the edge) is negative for laminin except some oval cell ductules enclosed in the focus (arrow head) (× 400); E: On day 15 after PH, most laminins are present around the focus, some laminins invading the hepatocyte clusters (arrows) (× 100).
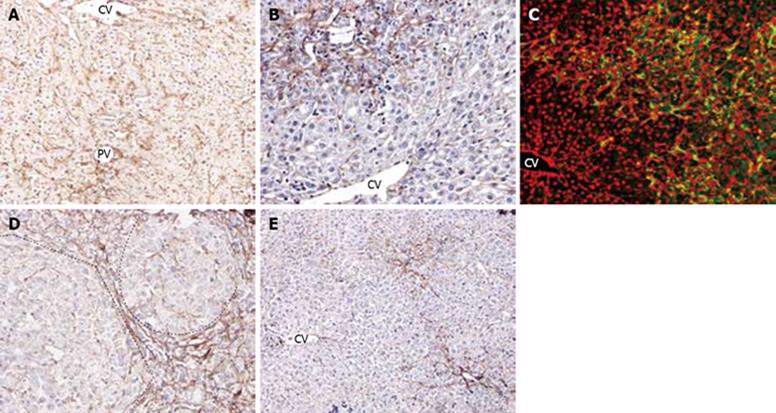
Figure 5 Fibronectin distribution and correlation with oval cell following PH of rats treated with AAF.
A: On day 2 after PH, there is a marked increase of fibronectin in the periportal, pericentral areas and interlobular sinusoids (× 100); B: On day 4 after PH, there is a decrease in number of fibronectin in pericentral zone and increase of fibronectin in periportal areas (× 200); C: Double immunofluorescent labelling for ov-6 (green) and fibronectin (red) on day 9 after PH. The ductular oval cells fanning outward from portal area were closely surrounded by fibronectin (× 200); D: On day 12 after PH, dash line marks the edge of a regenerative small hepatocyte focus. Fibronectin was present around the focus, very few in the nodus (× 200); E: On day 15 after PH, there is notable decrease of fibronectin during recovery of normal hepatic architecture (× 100).
- Citation: Zhang W, Chen XP, Zhang WG, Zhang F, Xiang S, Dong HH, Zhang L. Hepatic non-parenchymal cells and extracellular matrix participate in oval cell-mediated liver regeneration. World J Gastroenterol 2009; 15(5): 552-560
- URL: https://www.wjgnet.com/1007-9327/full/v15/i5/552.htm
- DOI: https://dx.doi.org/10.3748/wjg.15.552


