Copyright
©2009 The WJG Press and Baishideng.
World J Gastroenterol. Feb 7, 2009; 15(5): 552-560
Published online Feb 7, 2009. doi: 10.3748/wjg.15.552
Published online Feb 7, 2009. doi: 10.3748/wjg.15.552
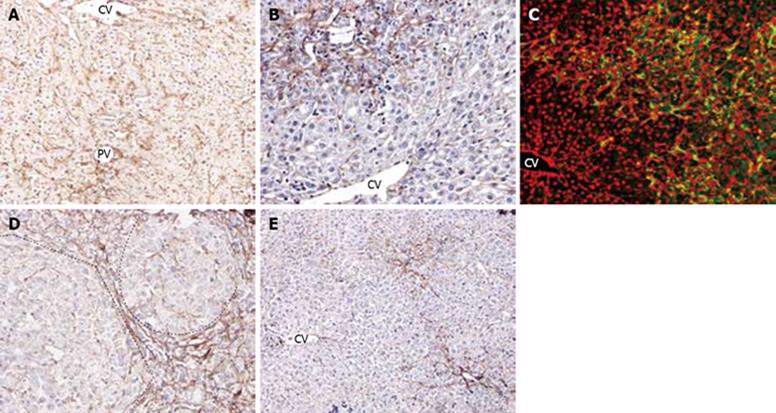
Figure 5 Fibronectin distribution and correlation with oval cell following PH of rats treated with AAF.
A: On day 2 after PH, there is a marked increase of fibronectin in the periportal, pericentral areas and interlobular sinusoids (× 100); B: On day 4 after PH, there is a decrease in number of fibronectin in pericentral zone and increase of fibronectin in periportal areas (× 200); C: Double immunofluorescent labelling for ov-6 (green) and fibronectin (red) on day 9 after PH. The ductular oval cells fanning outward from portal area were closely surrounded by fibronectin (× 200); D: On day 12 after PH, dash line marks the edge of a regenerative small hepatocyte focus. Fibronectin was present around the focus, very few in the nodus (× 200); E: On day 15 after PH, there is notable decrease of fibronectin during recovery of normal hepatic architecture (× 100).
- Citation: Zhang W, Chen XP, Zhang WG, Zhang F, Xiang S, Dong HH, Zhang L. Hepatic non-parenchymal cells and extracellular matrix participate in oval cell-mediated liver regeneration. World J Gastroenterol 2009; 15(5): 552-560
- URL: https://www.wjgnet.com/1007-9327/full/v15/i5/552.htm
- DOI: https://dx.doi.org/10.3748/wjg.15.552


