Copyright
©2009 The WJG Press and Baishideng.
World J Gastroenterol. Dec 14, 2009; 15(46): 5859-5863
Published online Dec 14, 2009. doi: 10.3748/wjg.15.5859
Published online Dec 14, 2009. doi: 10.3748/wjg.15.5859
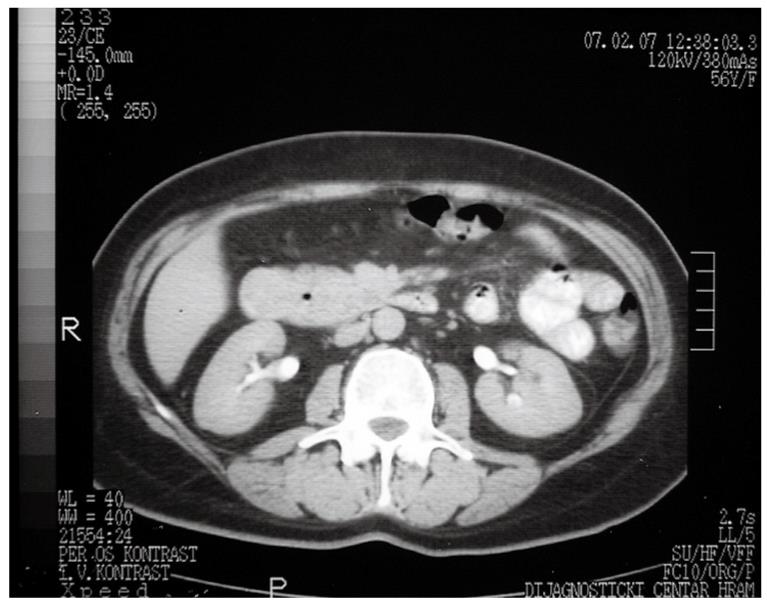
Figure 1 Computed tomography (CT) showing well-vascularized mass within the duodenum and in the head of the pancreas.
There is also a cystic lesion containing gas within the pancreatic mass.
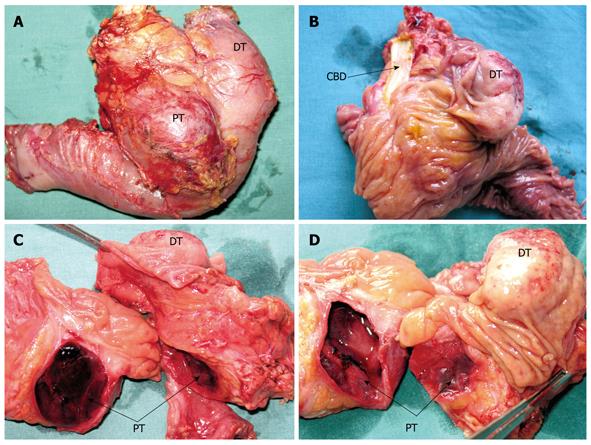
Figure 2 Resected duodenum and pancreatic head specimen containing both tumors.
A: Posterior aspect; B: Resected duodenum highlighting the duodenal tumor and common bile duct; C, D: Transected head of the pancreas showing the cystic pancreatic and duodenal tumors. DT: Duodenal tumor; PT: Pancreatic tumor; CBD: Common bile duct.
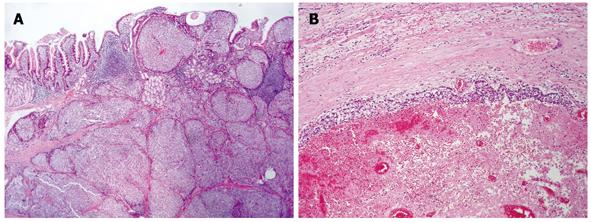
Figure 3 Histopathology.
A: Mucosal and submucosal tumor infiltration of the duodenum, revealing an insular growth of rather uniform epithelioid cells (HE, × 25); B: The pancreatic tumor presenting as a hemorrhagic pseudocyst, with a thin peripheral layer of neoplastic proliferation (HE, × 56).
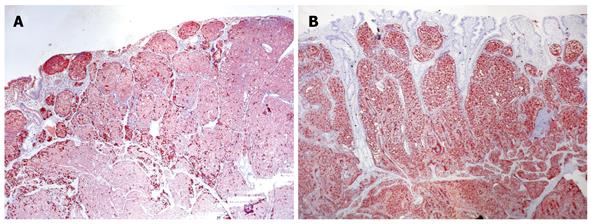
Figure 4 Duodenal tumor cells showing a non-homogeneous immunoreactivity against anti-chromogranin A antibody, but clear diffuse cytoplasmic immunohistochemical reactivity with anti-somatostatin antibody.
A: Chromogranin A immunoreactivity, × 56; B: Somatostatin immunoexpression, labeled streptavidin biotin (LSAB) method, aminoethylcarbazole (AEC) visualization, × 56.
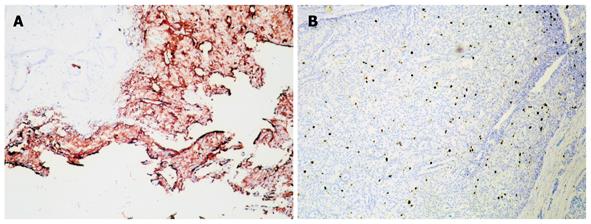
Figure 5 Pancreatic tumor cells showing strong immunoreactivity with anti-somatostatin antibody.
A: Somatostatin immunoreactivity, × 100; B: Ki-67 protein immunoexpression, LSAB+ method, AEC visualization, × 100.
- Citation: Čolović RB, Matić SV, Micev MT, Grubor NM, Atkinson HD, Latinčić SM. Two synchronous somatostatinomas of the duodenum and pancreatic head in one patient. World J Gastroenterol 2009; 15(46): 5859-5863
- URL: https://www.wjgnet.com/1007-9327/full/v15/i46/5859.htm
- DOI: https://dx.doi.org/10.3748/wjg.15.5859


