Copyright
©2009 The WJG Press and Baishideng.
World J Gastroenterol. Dec 7, 2009; 15(45): 5706-5711
Published online Dec 7, 2009. doi: 10.3748/wjg.15.5706
Published online Dec 7, 2009. doi: 10.3748/wjg.15.5706
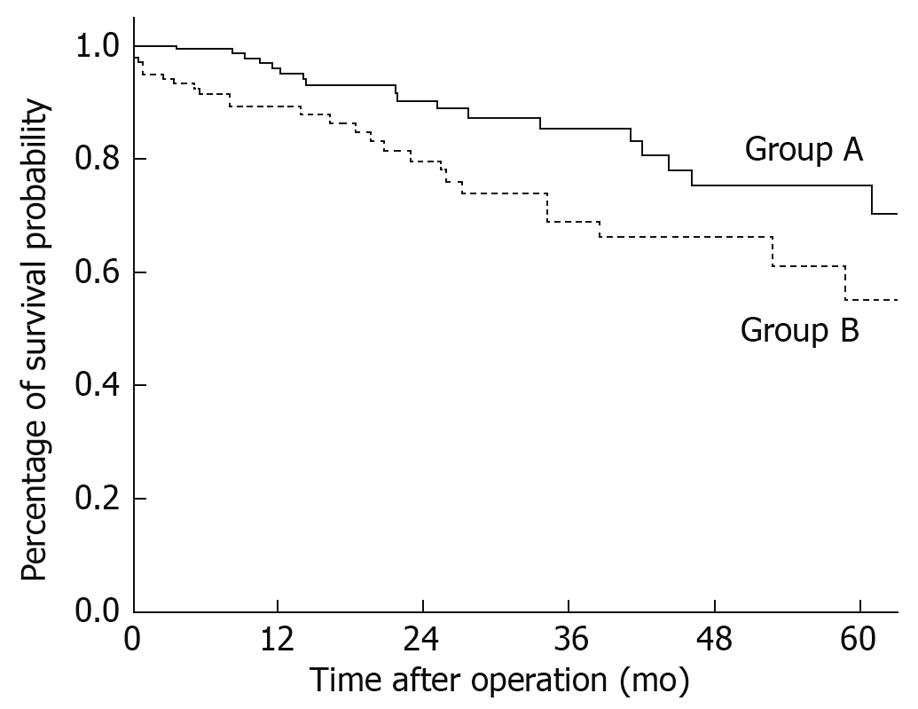
Figure 1 Kaplan-Meier estimates of survival probability for R0 population in group A (< 70 yr; 174 pts) and B (≥ 70 yr; 137 pts).
Postoperative, tumor-related and -unrelated deaths were included (Log-rank test, P = 0.006).
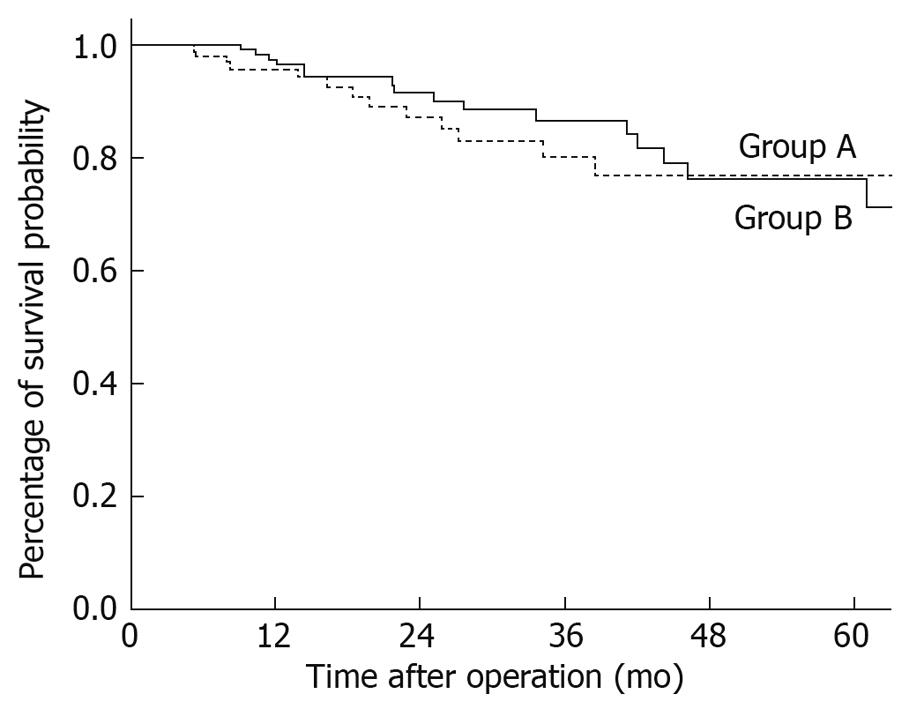
Figure 2 Kaplan-Meier estimates of disease-specific survival probability for R0 population in group A (< 70 yr; 174 pts) and B (≥ 70 yr; 137 pts).
Postoperative and tumor-related deaths were included (Log-rank test, P = 0.674).
- Citation: Pedrazzani C, Cerullo G, De Marco G, Marrelli D, Neri A, De Stefano A, Pinto E, Roviello F. Impact of age-related comorbidity on results of colorectal cancer surgery. World J Gastroenterol 2009; 15(45): 5706-5711
- URL: https://www.wjgnet.com/1007-9327/full/v15/i45/5706.htm
- DOI: https://dx.doi.org/10.3748/wjg.15.5706


